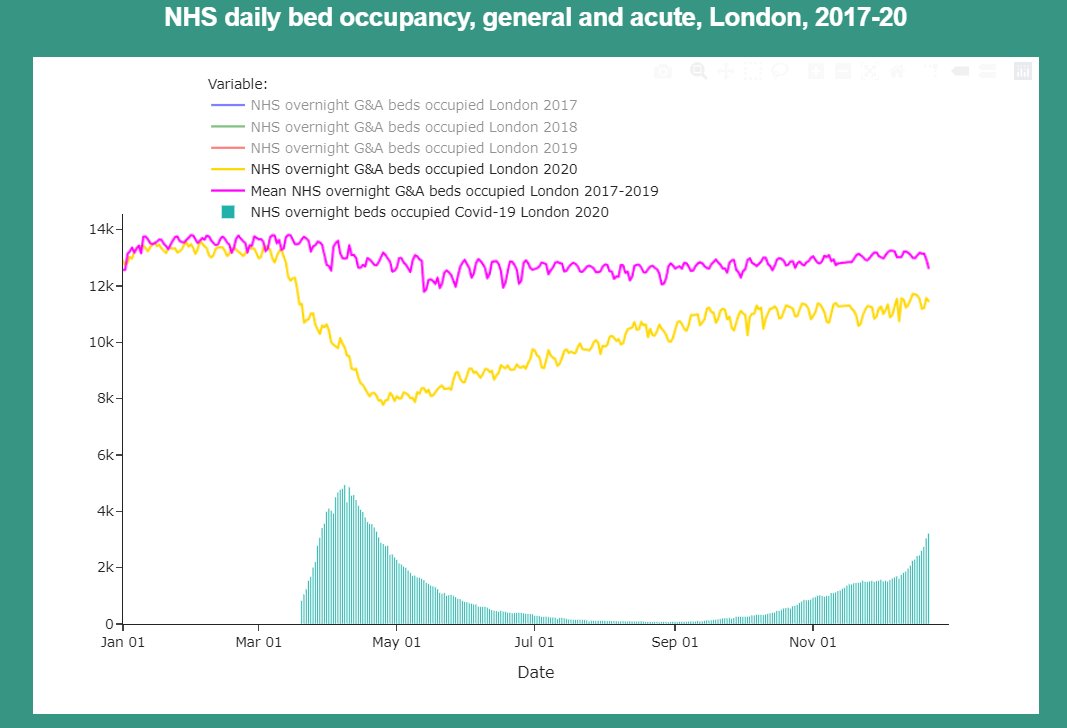
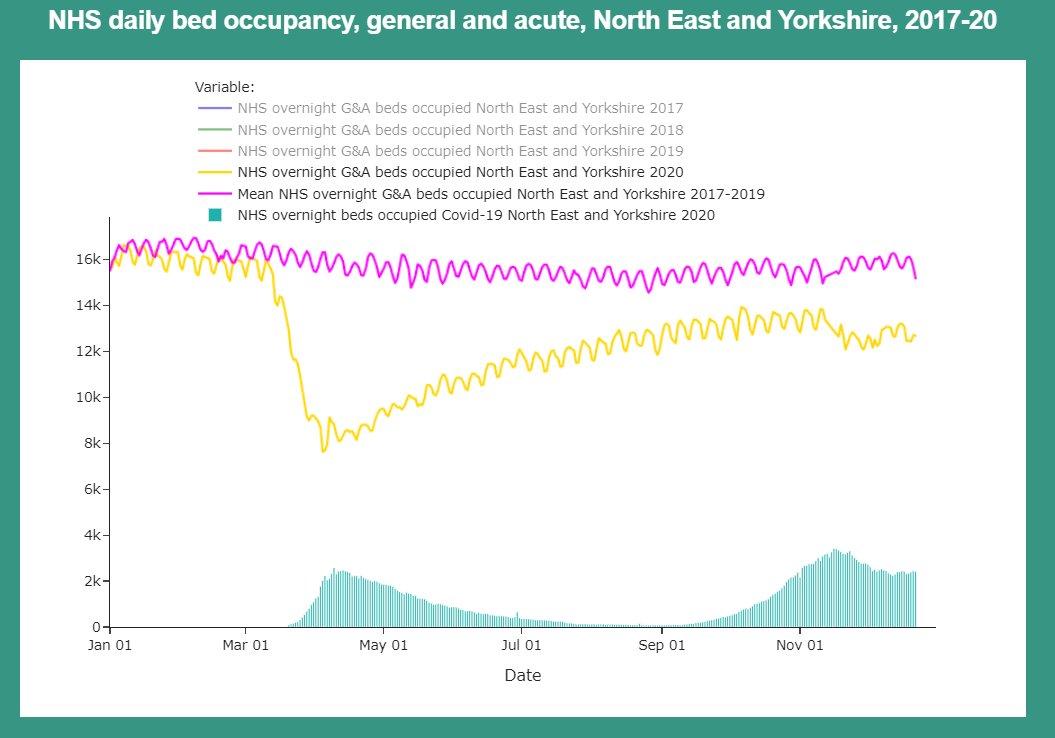
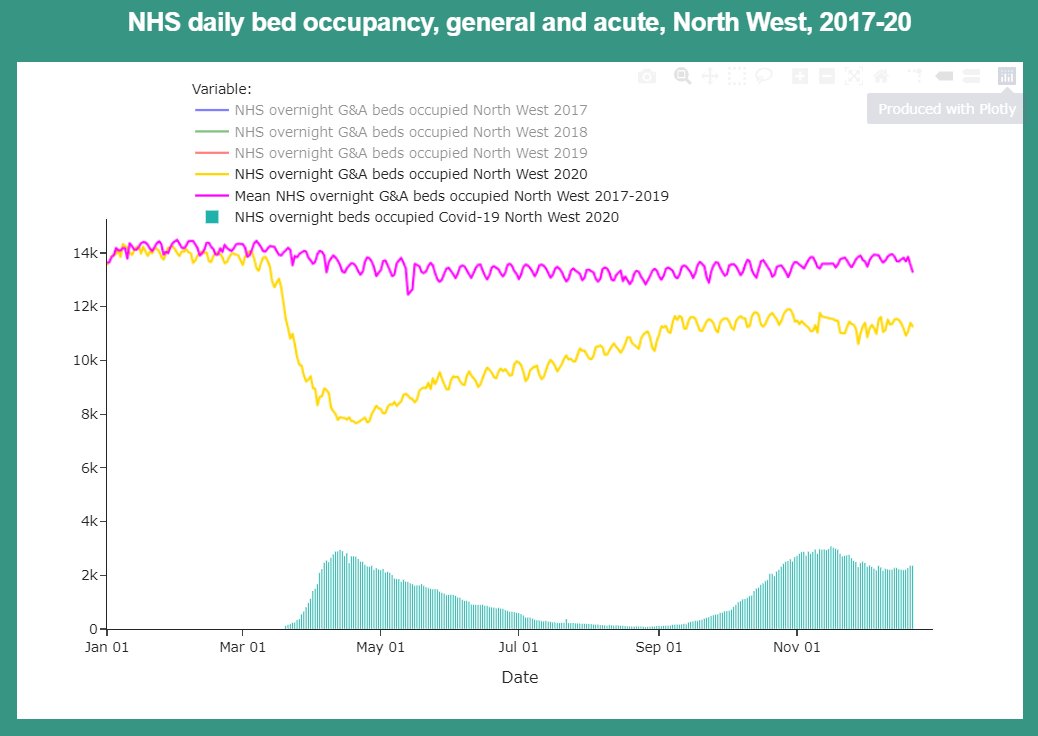
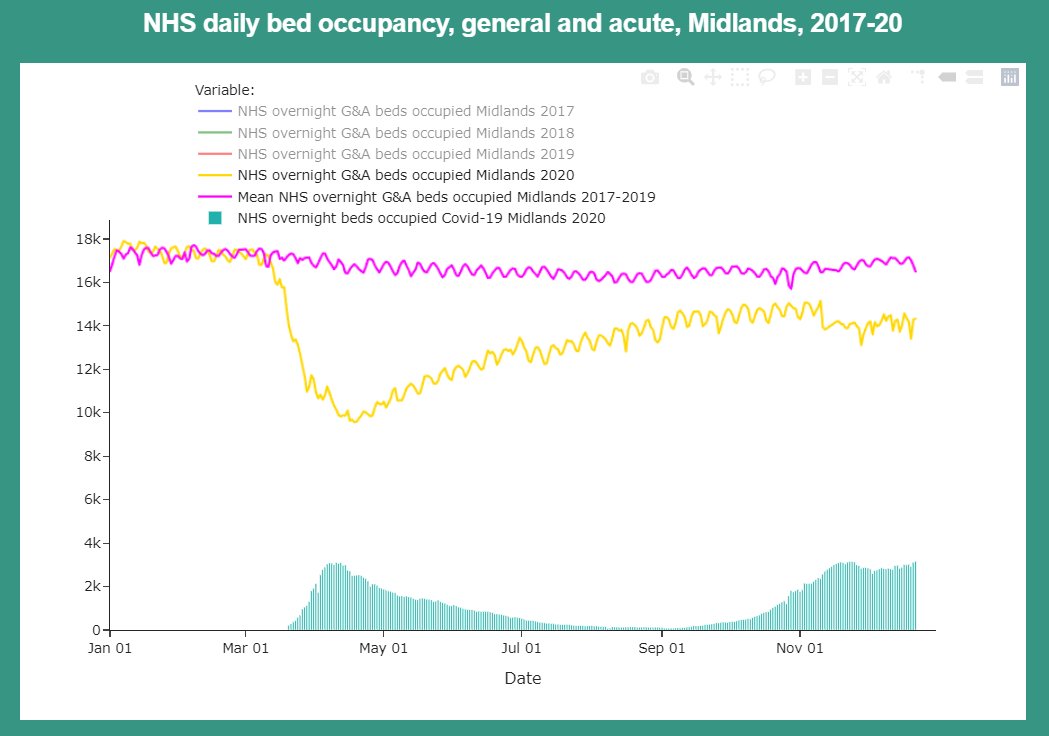
NHS bed occupancy 2020 (yellow line) versus a 2017-19 average (pink line), and covid positive patients (teal bars).
LONDON
All data is from NHS England - sources on our website.
LONDON
All data is from NHS England - sources on our website.
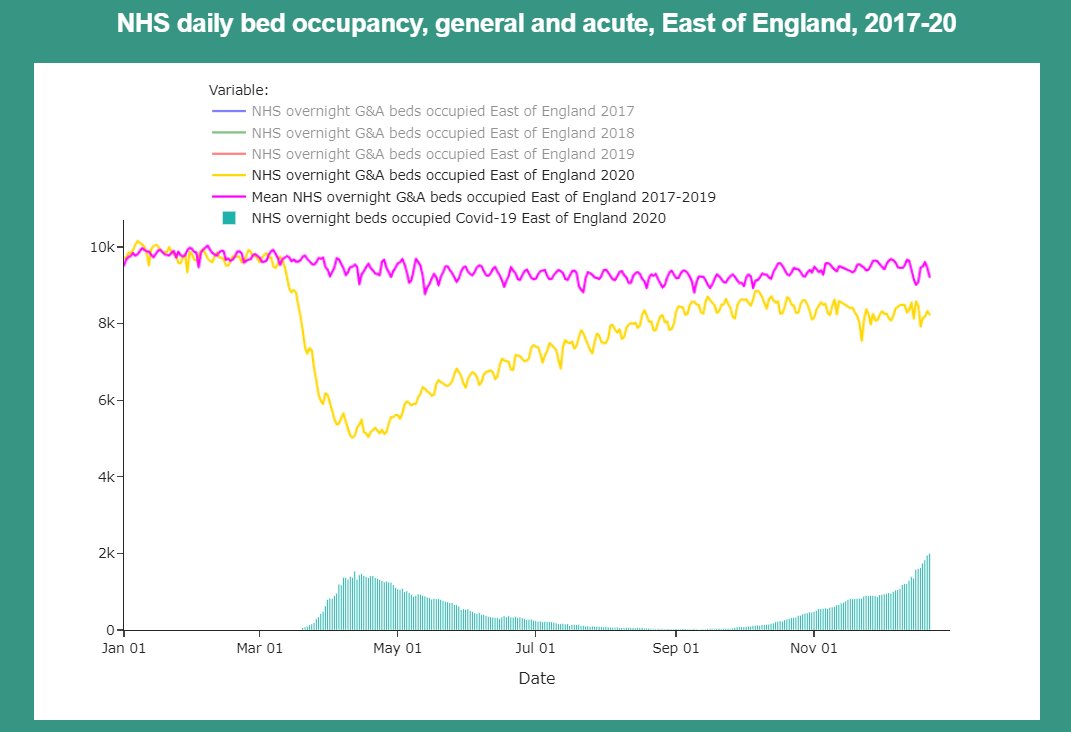
NHS bed occupancy 2020 (yellow line) versus a 2017-19 average (pink line), and covid positive patients (teal bars).
EAST OF ENGLAND
All data is from NHS England - sources on our website.
EAST OF ENGLAND
All data is from NHS England - sources on our website.
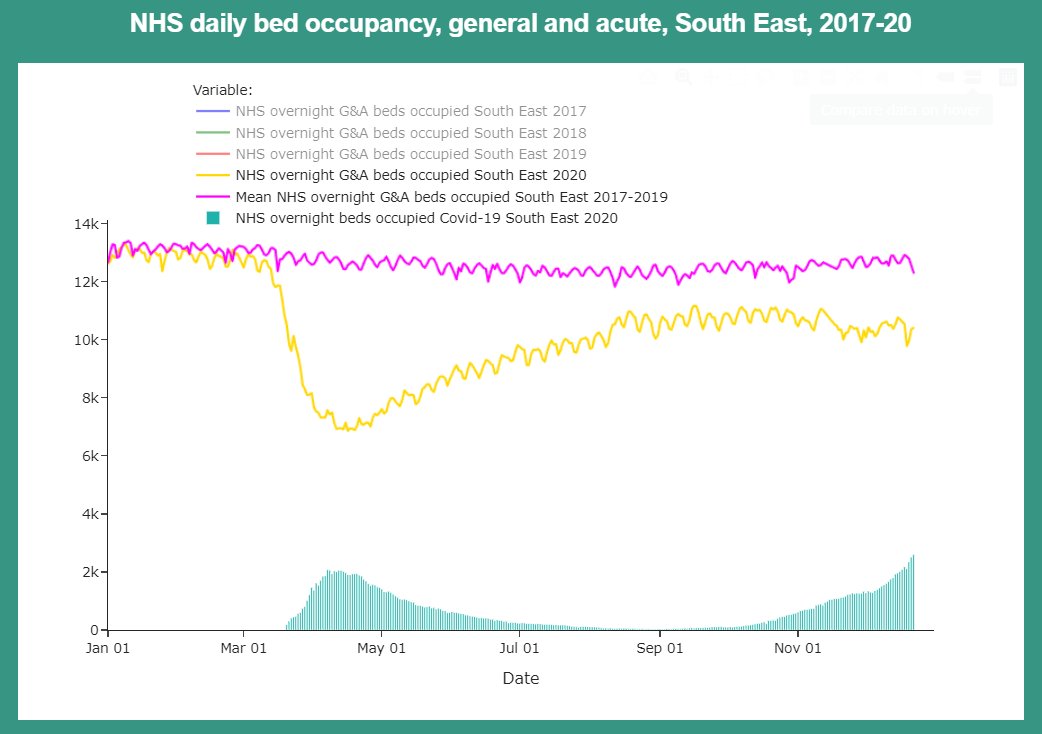
NHS bed occupancy 2020 (yellow line) versus a 2017-19 average (pink line), and covid positive patients (teal bars).
SOUTH EAST
All data is from NHS England - sources on our website.
SOUTH EAST
All data is from NHS England - sources on our website.
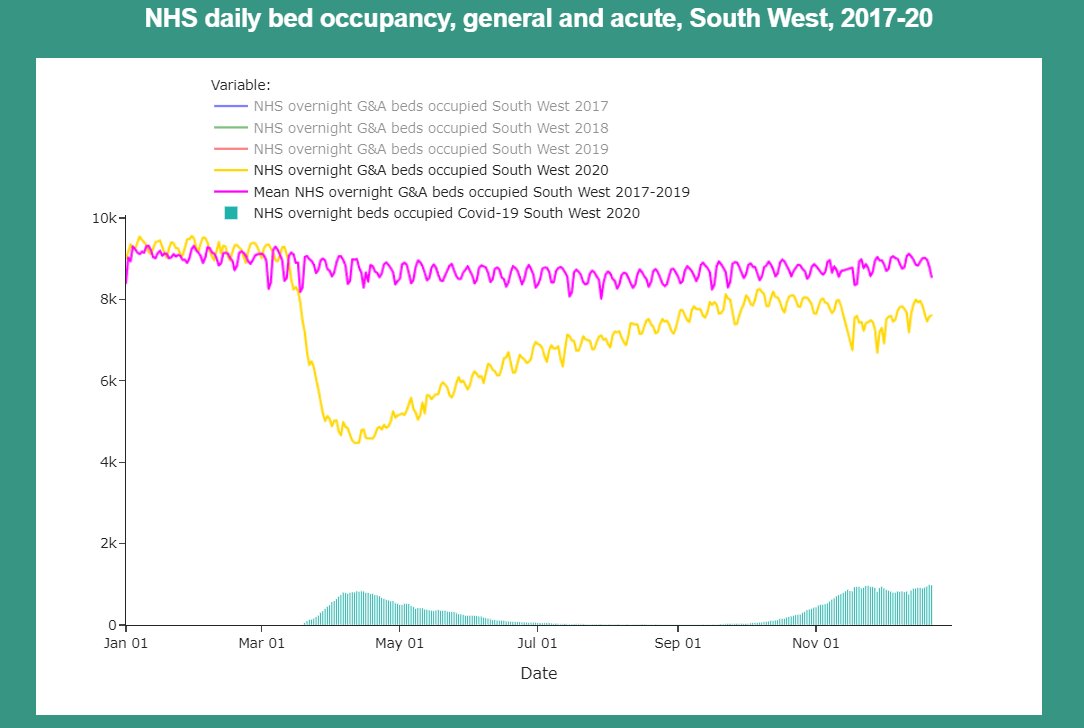
NHS bed occupancy 2020 (yellow line) versus a 2017-19 average (pink line), and covid positive patients (teal bars).
SOUTH WEST
All data is from NHS England - sources on our website.
SOUTH WEST
All data is from NHS England - sources on our website.
NHS bed occupancy 2020 (yellow line) versus a 2017-19 average (pink line), and covid positive patients (teal bars).
NORTH EAST AND YORKSHIRE
All data is from NHS England - sources on our website.
NORTH EAST AND YORKSHIRE
All data is from NHS England - sources on our website.
NHS bed occupancy 2020 (yellow line) versus a 2017-19 average (pink line), and covid positive patients (teal bars).
NORTH WEST
All data is from NHS England - sources on our website.
NORTH WEST
All data is from NHS England - sources on our website.

 Read on Twitter