Been trying to figure out decision to leave these London areas out of the contingency plans for primary schools: Camden, Greenwich, Hackney, Harringay, Harrow, Islington, Lambeth, Lewisham, Kingston, Redbridge.
This link, implementation, doc, Appendix A. https://www.gov.uk/government/publications/coronavirus-covid-19-contingency-framework-for-education-and-childcare-settings
This link, implementation, doc, Appendix A. https://www.gov.uk/government/publications/coronavirus-covid-19-contingency-framework-for-education-and-childcare-settings
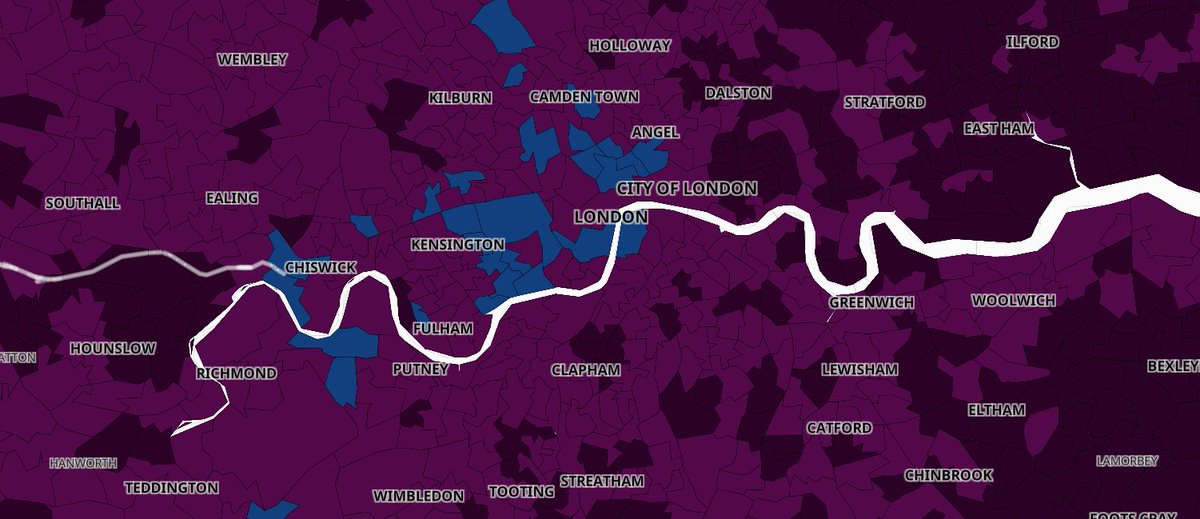
Of course this is a problem for all Tier 4 areas left out, but looking at this portion can be instructive. I have not seen criteria published on why these areas were not included; would be interested if anyone has seen! Not an easy clear match to cases: https://coronavirus.data.gov.uk/details/interactive-map
Not an easy fit, and the problem that these 10 areas border on areas that will be under the contingency measures. So I checked local council election info, just to see, here: https://www.londoncouncils.gov.uk/who-runs-london/london-local-elections/2018-london-election-results
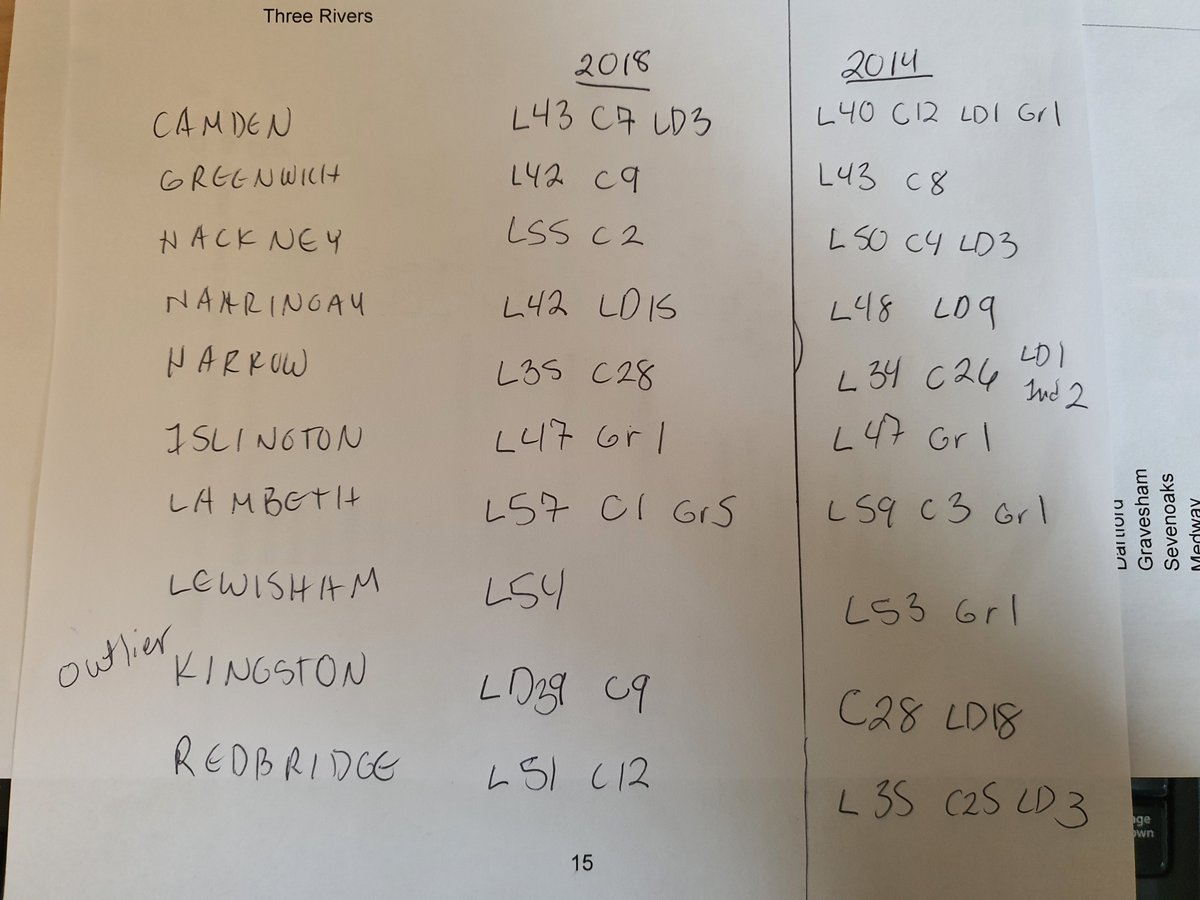
There are a variety of different council configurations among the 22 local authorities who are under the contingency measures, so there initially seems no obvious relation. But of 10 left out, all but 1 (Kingston) have very solid Labour council majorities.
By solid, I mean that there was no change in the general Labour dominance on the council between 2014 and 2018. Here is the breakdown, source is the London Councils website mentioned above.
What does this mean exactly? Well, without a publication of the selection criteria, speculation like this will run rampant. So let's hope that criteria and perhaps some additions to this list will follow.
If there is a kind of influence, my work on local-central political interactions leads me to say that this is likely to be easier to see or unsee with qualitative info, rather than just the numbers. Particular local politicians, particular events (see Greenwich tussle last week).
From our region, it makes no sense that Kingston has been left out from a data perspective. Makes me think it could be interesting to dig a bit further. Or perhaps the government should simply publish its criteria for this selection.

 Read on Twitter


