A thread of some of my favorite failed data viz projects of 2020.
#1 Back in February I started on this draft analysis so I could check out @tableau animations. It shows every player drafted as a dot. I never published because my findings were super boring and I lost interest.
#1 Back in February I started on this draft analysis so I could check out @tableau animations. It shows every player drafted as a dot. I never published because my findings were super boring and I lost interest.
#2 This one I was calling Winds of Change (pretentious nonsense) & was almost done. It shows change in voting patterns by county from 2016 to 2020. Up/right = more votes/more GOP. Down/left = less votes/more Dem. I never published because I was tired of politics & I hate this.
#3 This one was called "Please Move Over". It's a letter to my family about my lack of bed space (relative to my body mass index) on weekend mornings when our 4 year old gets into our bed. My wife claims the data collection was faulty and fraught with bias. She was 100% correct.
#4 I never came to close to finishing this project. I wanted to show the story of the 2016 Olympics Men's 4X100 Meter Freestyle Relay. I never published because the movement is too jenky (look at Mitch boogie) and I lost interest in the story.
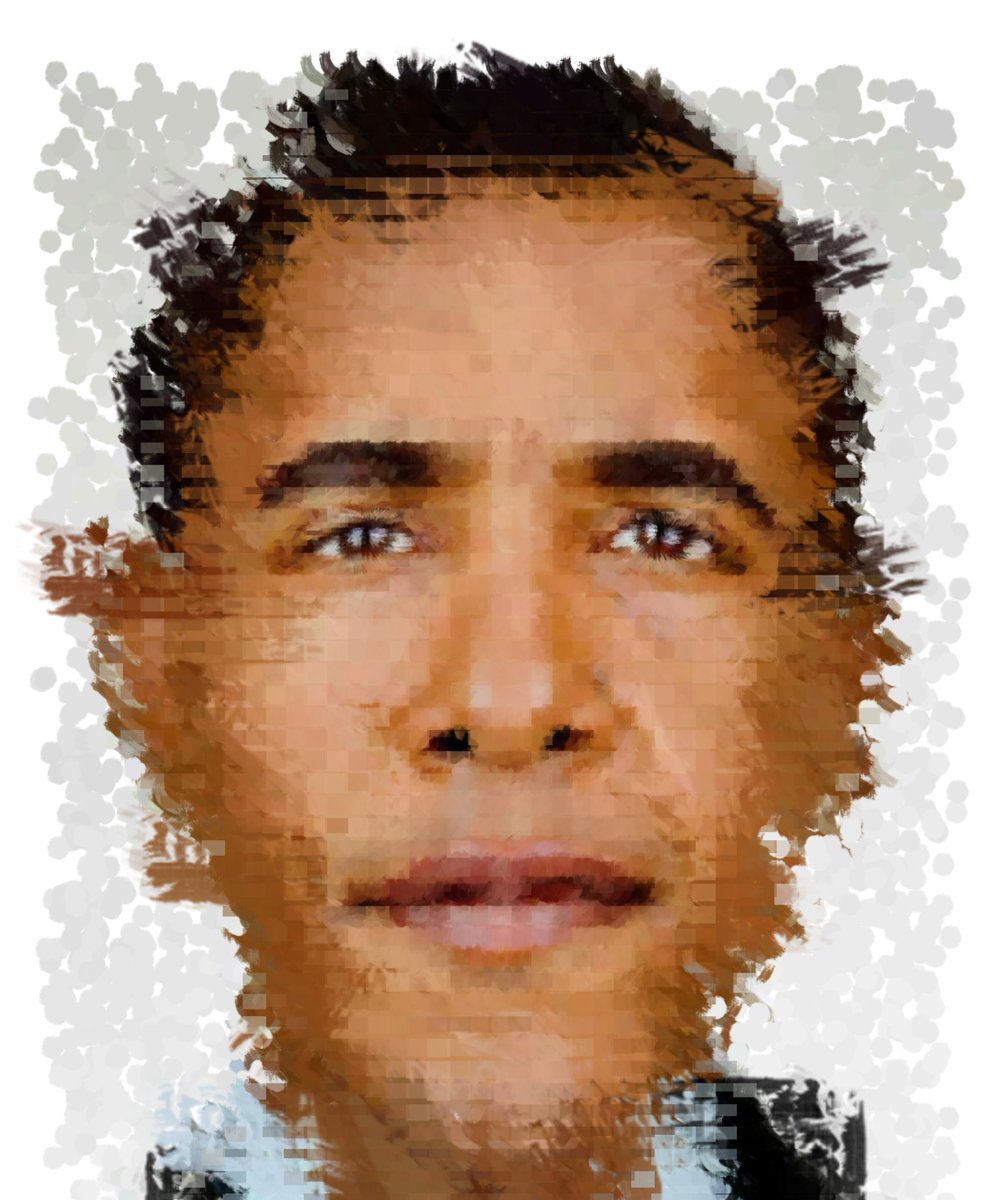
#5 I was really into "painting" with Tableau for a while. I made a few painterly style portraits which layer different brush strokes as custom shapes. I spent an absurd amount of time on Obama's eyes creating spiral brush strokes. I ultimately didn't like the final products.
#6 This drill-able bar chart allows you to click and drill to see details or sub-categories within the bar using parameter actions. I don't know why I didn't publish to my site. But it's not really novel.
This one is on @tableaupublic https://public.tableau.com/profile/adam.e.mccann#!/vizhome/ParameterActions-DrillableBarChart/ParameterDrillableBarChart
This one is on @tableaupublic https://public.tableau.com/profile/adam.e.mccann#!/vizhome/ParameterActions-DrillableBarChart/ParameterDrillableBarChart
#7 This last one is the final test for an animated scrolly viz I wanted to make. I wanted a scrolly telling style viz that moves the reader thru a story. Ultimately the final test was too jenky & unintuitive to move forward. I will never make a good scrolly telling viz in Tableau
These are just some of my failed projects from 2020. There are more. I usually failed because I couldn't find what was interesting in the data. Ultimately I learned something from each that I then used later on. So in that sense they were successes. I hope you enjoyed my failure!

 Read on Twitter


