It's sad we still need to say this, but false positives are NOT driving rising cases.
In the summer the False Positive Rate (FPR) at lots of labs was below 0.1%.
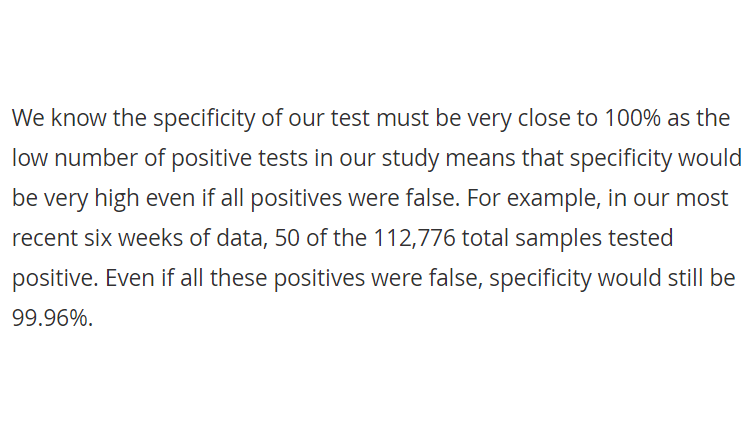
For example, Milton Keynes' FPR for the ONS Infection Survey was less than 0.04% in July.
https://www.ons.gov.uk/peoplepopulationandcommunity/healthandsocialcare/conditionsanddiseases/bulletins/coronaviruscovid19infectionsurveypilot/england17july2020#test-sensitivity-and-specificity
In fact, when prevalence was low, labs all over the world had less than 0.1% of tests give a positive result.
So their FPR (the % of people they tested who didn't have the virus but got a positive result) must also have been less than 0.1% at the time. https://twitter.com/_johnbye/status/1317445804613914624?s=20
So their FPR (the % of people they tested who didn't have the virus but got a positive result) must also have been less than 0.1% at the time. https://twitter.com/_johnbye/status/1317445804613914624?s=20
So there's nothing fundamentally wrong with PCR. It doesn't conjure up lots of false positives out of thin air when nobody has the virus.
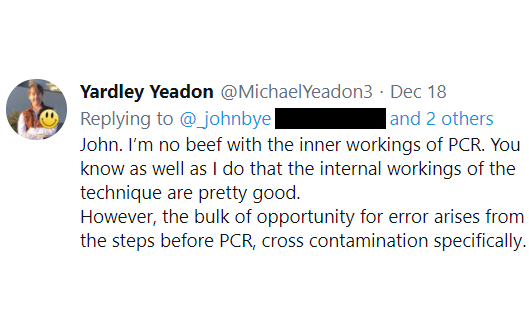
Any false positives would mostly come from cross contamination or errors, either when the sample is taken or at the lab when it's processed.
Any false positives would mostly come from cross contamination or errors, either when the sample is taken or at the lab when it's processed.
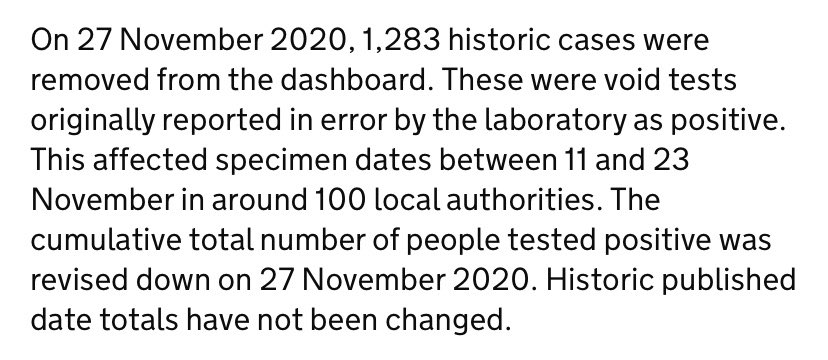
We know errors can occur at labs. In late November, for example, 1,283 people got a (possibly) false positive due to a contaminated primer at Milton Keynes.
But the error was spotted, the false positives removed from the reported cases total, and those people offered a retest.
But the error was spotted, the false positives removed from the reported cases total, and those people offered a retest.
This sounds like a major error, but 1,007,538 tests were processed at Lighthouse Labs during that period.
About 80,000 of them were positive.
So even if there were similar errors every day at every Lighthouse Lab, it would barely make any difference at all to case numbers.
About 80,000 of them were positive.
So even if there were similar errors every day at every Lighthouse Lab, it would barely make any difference at all to case numbers.
And this issue was quickly spotted, because labs have internal checks and look out for any unusual patterns in the results they're getting.
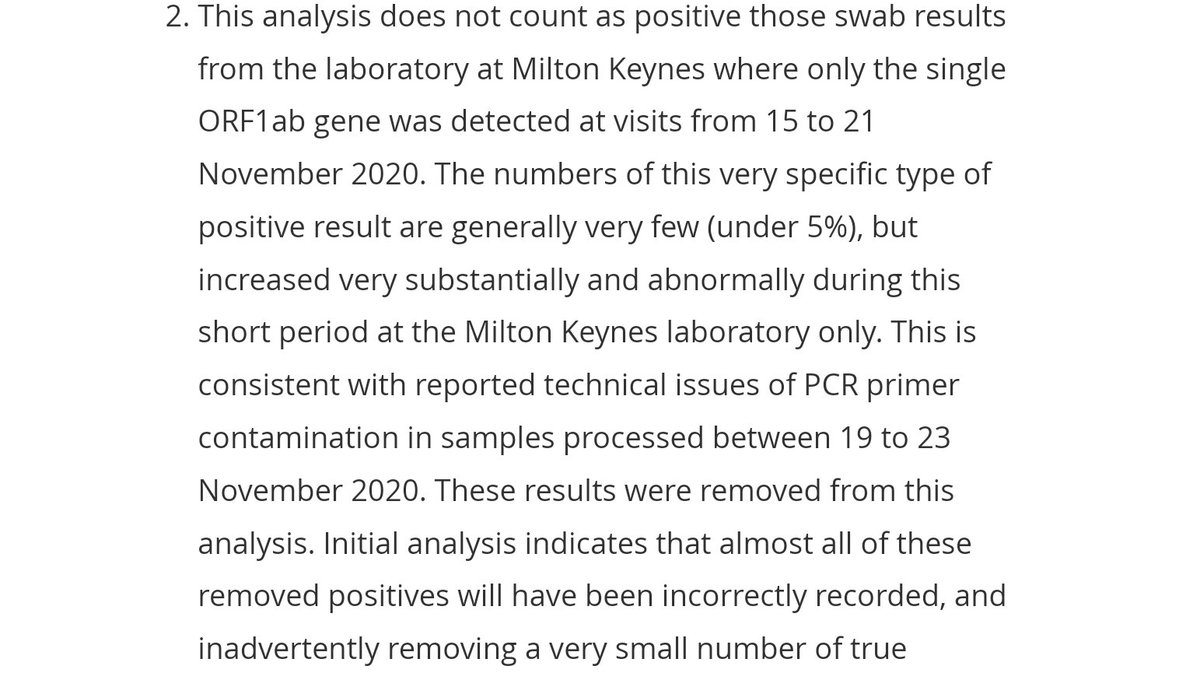
In this case, the primer issue caused a big jump in the number of positives that only found the ORF1ab gene (one of three they check for).
In this case, the primer issue caused a big jump in the number of positives that only found the ORF1ab gene (one of three they check for).
This is also how the new covid strain was spotted.
Both the Milton Keynes AND Birmingham Lighthouse Labs noticed an unusual number of positives that found two of the three genes they look for, but not the S gene, which is mutated in the new strain. https://www.theguardian.com/commentisfree/2020/dec/22/new-coronavirus-variant-b117-transmitting
Both the Milton Keynes AND Birmingham Lighthouse Labs noticed an unusual number of positives that found two of the three genes they look for, but not the S gene, which is mutated in the new strain. https://www.theguardian.com/commentisfree/2020/dec/22/new-coronavirus-variant-b117-transmitting
So no, the surge in cases of the new strain in London and the South East is NOT caused by an outbreak at the Milton Keynes lab.
Because tests are sent all over the country for processing, not just to the closest lab, and other labs see the same pattern. https://www.theguardian.com/world/2020/dec/24/staff-at-uk-coronavirus-testing-lab-hit-by-outbreak-of-the-disease
Because tests are sent all over the country for processing, not just to the closest lab, and other labs see the same pattern. https://www.theguardian.com/world/2020/dec/24/staff-at-uk-coronavirus-testing-lab-hit-by-outbreak-of-the-disease
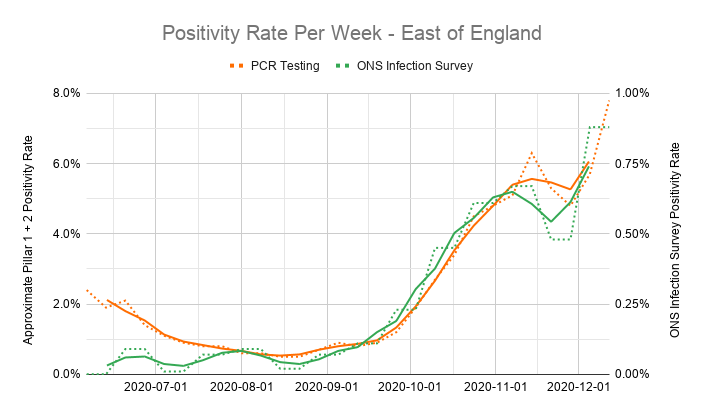
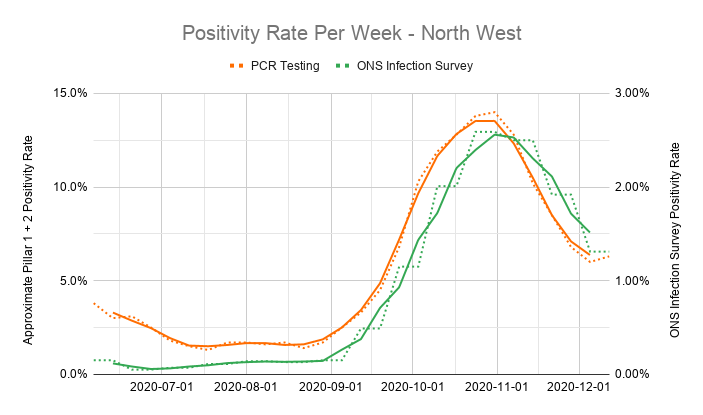
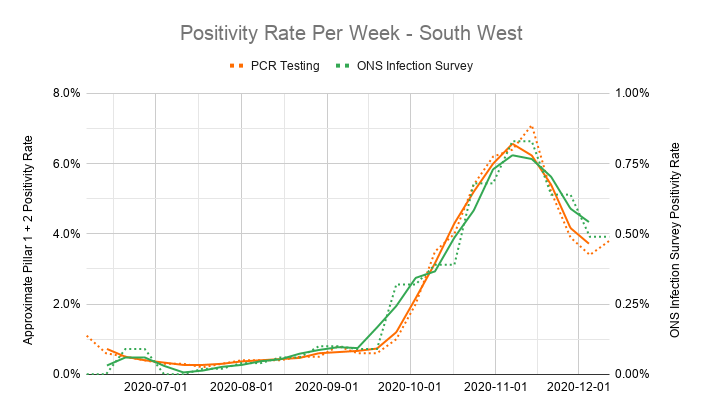
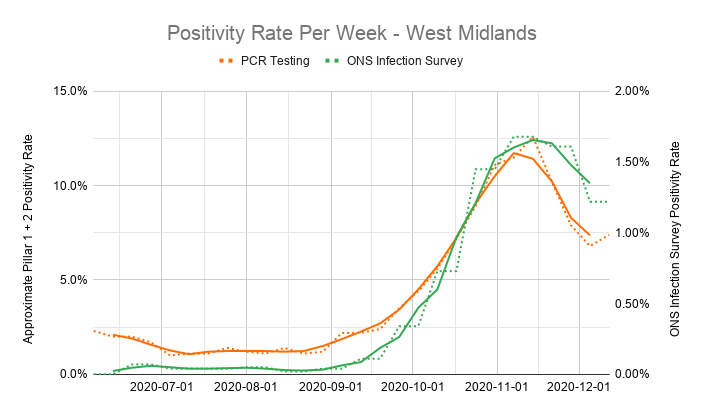
Another sign is that within each region, results from the ONS Infection Survey (whose tests are all processed at Milton Keynes) closely follow the percentage of positive results from hospital and community testing (which are sent to labs all over the country for processing).
The percentage of tests that are positive rises and falls at different times in different regions, but within each region it follows a similar curve, wherever tests were processed.
This wouldn't happen so consistently and smoothly if lots of positives were caused by lab errors.
This wouldn't happen so consistently and smoothly if lots of positives were caused by lab errors.
So what about test sites?
This is harder to unpick because the government doesn't release data for individual test sites or for different ways of getting tested.
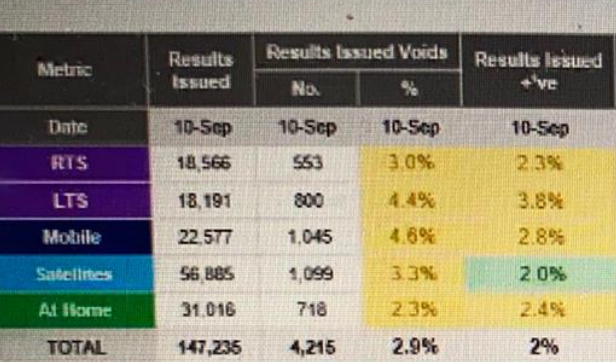
The one snapshot we do have is from a leak to the Sunday Times in early September. https://twitter.com/Gabriel_Pogrund/status/1305047753983225858
This is harder to unpick because the government doesn't release data for individual test sites or for different ways of getting tested.
The one snapshot we do have is from a leak to the Sunday Times in early September. https://twitter.com/Gabriel_Pogrund/status/1305047753983225858
This shows the percentage of tests that were positive was almost identical for drive through Regional Test Sites (2.3%), where there were concerns about handling of tests, and mail-in test kits used in your own Home (2.4%), where cross contamination really shouldn't be an issue!
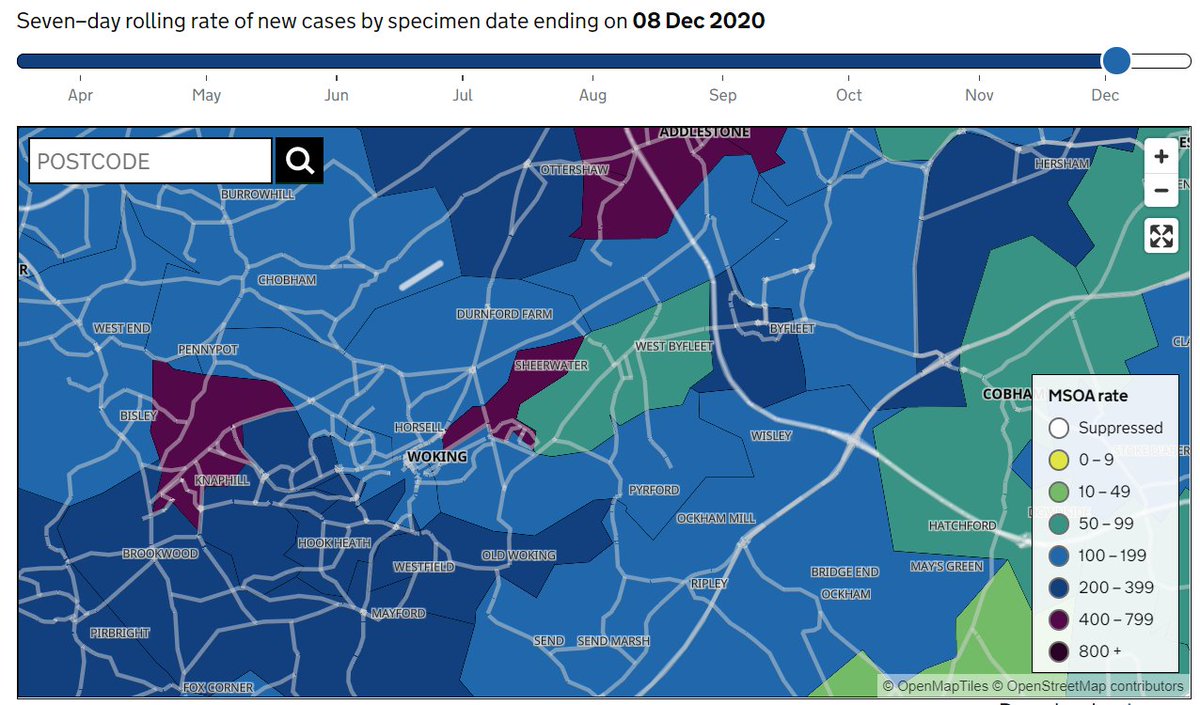
Another sign that cross contamination at test sites isn't a major factor in the rise in cases is that if you look at a map of positive tests by council ward, neighbouring areas that share the same test sites often have wildly different numbers of cases. https://coronavirus.data.gov.uk/details/interactive-map
For example, a couple of weeks ago here in Woking, North Pyrford & West Byfleet had 55 cases per 100,000 people per week, but neighbouring Sheerwater had 400!
Woking's only permanent test site is in Sheerwater. But surrounding areas sharing that site had much lower case numbers.
Woking's only permanent test site is in Sheerwater. But surrounding areas sharing that site had much lower case numbers.
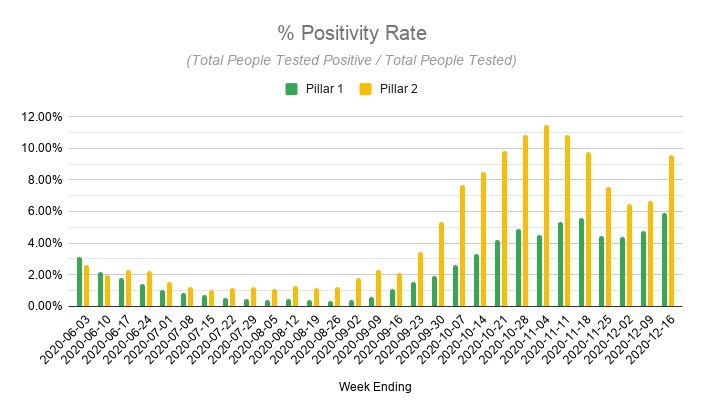
And then there's the fact that we have two separate PCR testing systems, with positivity rates following much the same curve.
Pillar 1 tests are done and processed in hospitals.
Pillar 2 tests are done at homes, care homes and test sites, and processed in Lighthouse Labs.
Pillar 1 tests are done and processed in hospitals.
Pillar 2 tests are done at homes, care homes and test sites, and processed in Lighthouse Labs.
If a significant proportion of the positives were false you wouldn't expect to see such similar patterns from what's essentially two completely separate testing systems.
Different equipment, in different labs, processing samples taken at different places. Giving similar results.
Different equipment, in different labs, processing samples taken at different places. Giving similar results.
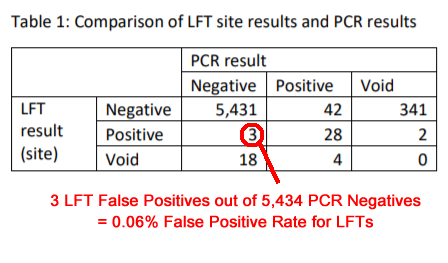
Even data from Lateral Flow Tests points to PCR being accurate.
Lateral Flow Tests give results on the spot within 30 minutes and never go near a lab.
And the Liverpool trial suggests they have a very low False Positive Rate too.
https://www.liverpool.ac.uk/media/livacuk/coronavirus/Liverpool,Community,Testing,Pilot,Interim,Evaluation.pdf
Lateral Flow Tests give results on the spot within 30 minutes and never go near a lab.
And the Liverpool trial suggests they have a very low False Positive Rate too.
https://www.liverpool.ac.uk/media/livacuk/coronavirus/Liverpool,Community,Testing,Pilot,Interim,Evaluation.pdf
In Liverpool, LFTs were ONLY used to test asymptomatic people, and in November 0.9% were positive.
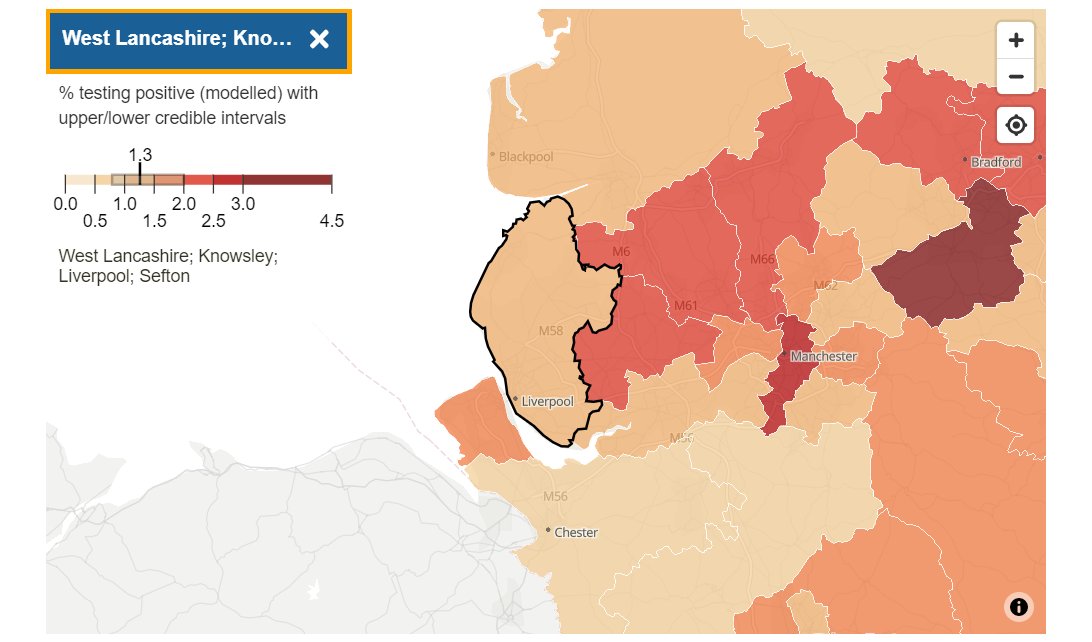
At the same time the ONS (which tests random people with PCR) found that 1.3% of people in and around Liverpool had the virus.
A third had symptoms. Leaving .. 0.9% asymptomatics.
At the same time the ONS (which tests random people with PCR) found that 1.3% of people in and around Liverpool had the virus.
A third had symptoms. Leaving .. 0.9% asymptomatics.
In fact there's no huge discrepancy between results from Lateral Flow Tests and PCR tests IF you compare like and like.
It only looks like there's an issue if you compare testing of people WITH symptoms (half of Pillar 2 testing) to testing of people WITHOUT symptoms (all LFTs).
It only looks like there's an issue if you compare testing of people WITH symptoms (half of Pillar 2 testing) to testing of people WITHOUT symptoms (all LFTs).
So it doesn't look like rising cases are caused by false positives.
But could they be caused by PCR picking up remnants of old, previously undetected infections? After all, we know it's possible to test positive several weeks after you were infected. https://www.bbc.co.uk/news/health-54000629
But could they be caused by PCR picking up remnants of old, previously undetected infections? After all, we know it's possible to test positive several weeks after you were infected. https://www.bbc.co.uk/news/health-54000629
Well, that only really makes sense if cases are falling and testing wasn't widely available before (like in June / July).
Most people being tested now either have symptoms or have been tested before (most of them regularly, as part of screening in hospitals and care homes).
Most people being tested now either have symptoms or have been tested before (most of them regularly, as part of screening in hospitals and care homes).
People only count as a case the first time they test positive.
So the only way we'd get a surge in cases now from old infections would be if LOTS of people in London had the virus a month or two ago, didn't get tested then, but are getting tested now.
Which doesn't make sense.
So the only way we'd get a surge in cases now from old infections would be if LOTS of people in London had the virus a month or two ago, didn't get tested then, but are getting tested now.
Which doesn't make sense.
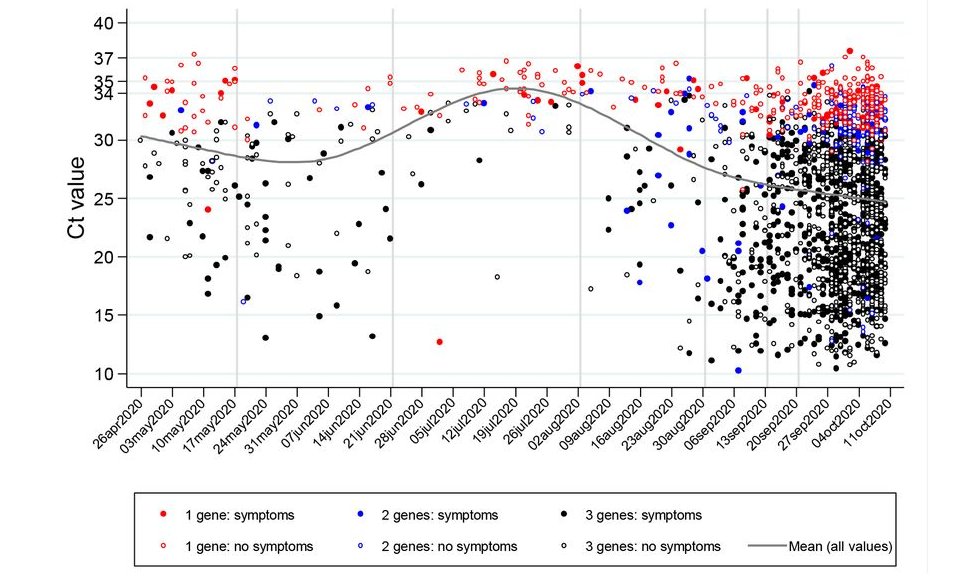
Also, if this was happening you'd expect most positives to be found at high Ct values (basically, how many thermal cycles you had to put the sample through before you got a positive result from it).
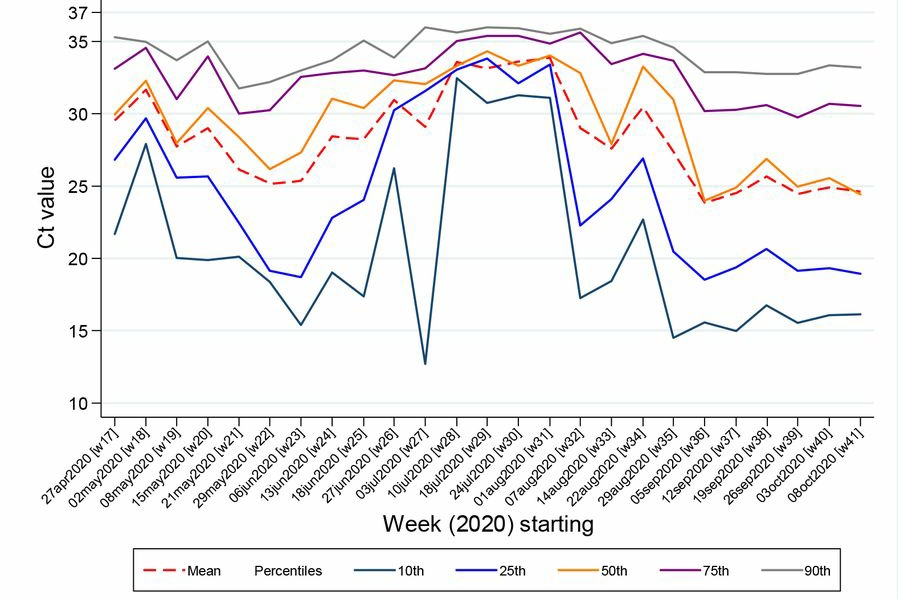
But when cases rose in September, the average Ct they were found at FELL.
But when cases rose in September, the average Ct they were found at FELL.
Unfortunately labs don't regularly release data on Ct values, but the data we do have (from the ONS again) shows only 4 of their positives were EVER found at Ct 37+, and as cases rose the average Ct they were found at fell and 75% were found at Ct 30 or lower (the purple line).
Which is what you'd expect to see when the virus was rapidly spreading.
The proportion of positives that come from people who are currently or recently infected would go up, and these would tend to be found at lower Cts.
The same should be true now, IF the data was published.
The proportion of positives that come from people who are currently or recently infected would go up, and these would tend to be found at lower Cts.
The same should be true now, IF the data was published.
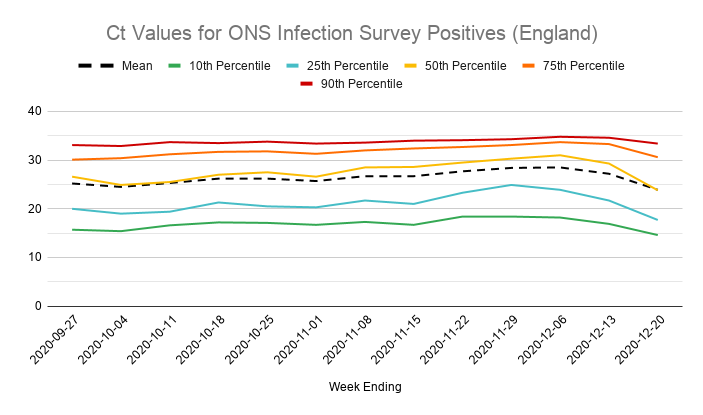
Update: thanks to @jneill and @AdamJRuby for spotting that the ONS *does* now publish data on Ct values from their Infection Survey.
As expected, this shows Ct values slowly crept up in November as cases fell, and then dropped sharply in December as cases rapidly rose again.
As expected, this shows Ct values slowly crept up in November as cases fell, and then dropped sharply in December as cases rapidly rose again.

 Read on Twitter