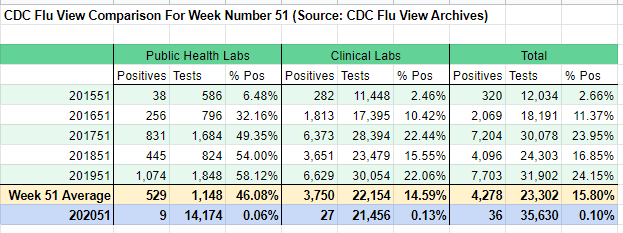
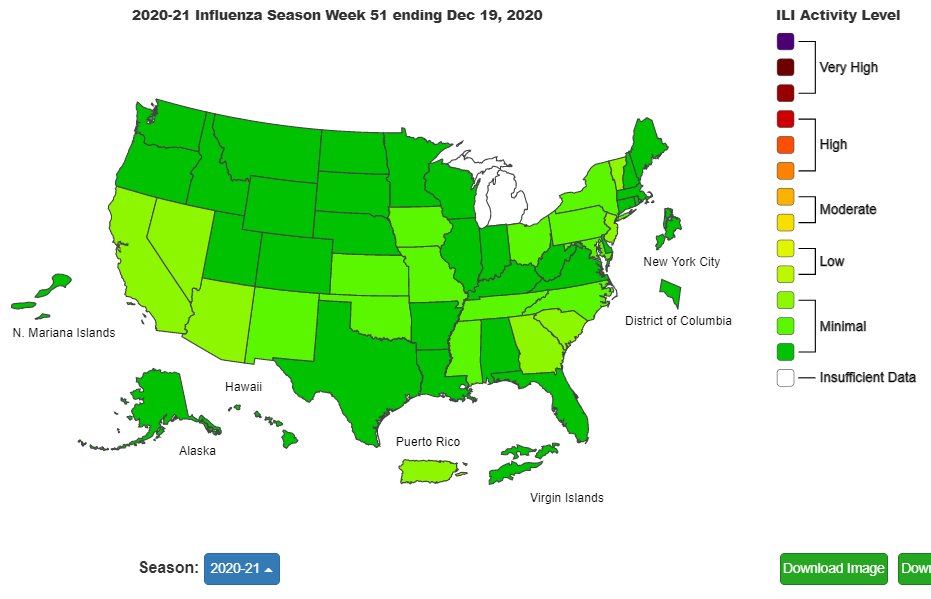
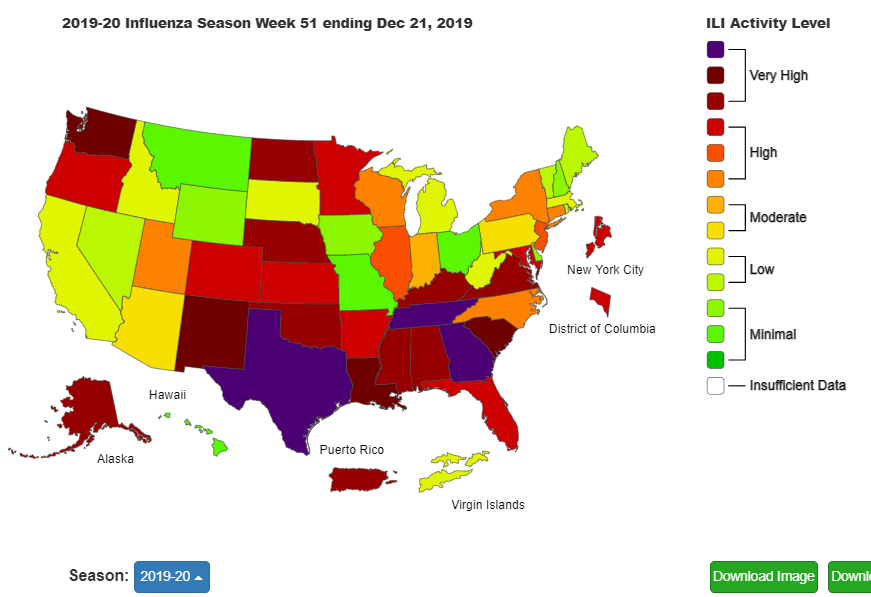
Influenza testing, week 51.
CDC flu view. https://cdc.gov/flu/weekly/index.htm
Five-year average: 15.80% positive
This year: 0.10%
https://docs.google.com/spreadsheets/d/1JXUW_6CF4e04iAWyC_MU23SY6scEYUo4GKEXmQUhHbo/edit?usp=sharing
CDC flu view. https://cdc.gov/flu/weekly/index.htm
Five-year average: 15.80% positive
This year: 0.10%
https://docs.google.com/spreadsheets/d/1JXUW_6CF4e04iAWyC_MU23SY6scEYUo4GKEXmQUhHbo/edit?usp=sharing
Influenza testing season-to-date (12 weeks from 40 to 51).
CDC flu view. https://cdc.gov/flu/weekly/index.htm
Five-year average: 6.77% positive
This year: 0.17%
https://docs.google.com/spreadsheets/d/1JXUW_6CF4e04iAWyC_MU23SY6scEYUo4GKEXmQUhHbo/edit?usp=sharing
CDC flu view. https://cdc.gov/flu/weekly/index.htm
Five-year average: 6.77% positive
This year: 0.17%
https://docs.google.com/spreadsheets/d/1JXUW_6CF4e04iAWyC_MU23SY6scEYUo4GKEXmQUhHbo/edit?usp=sharing

 Read on Twitter


