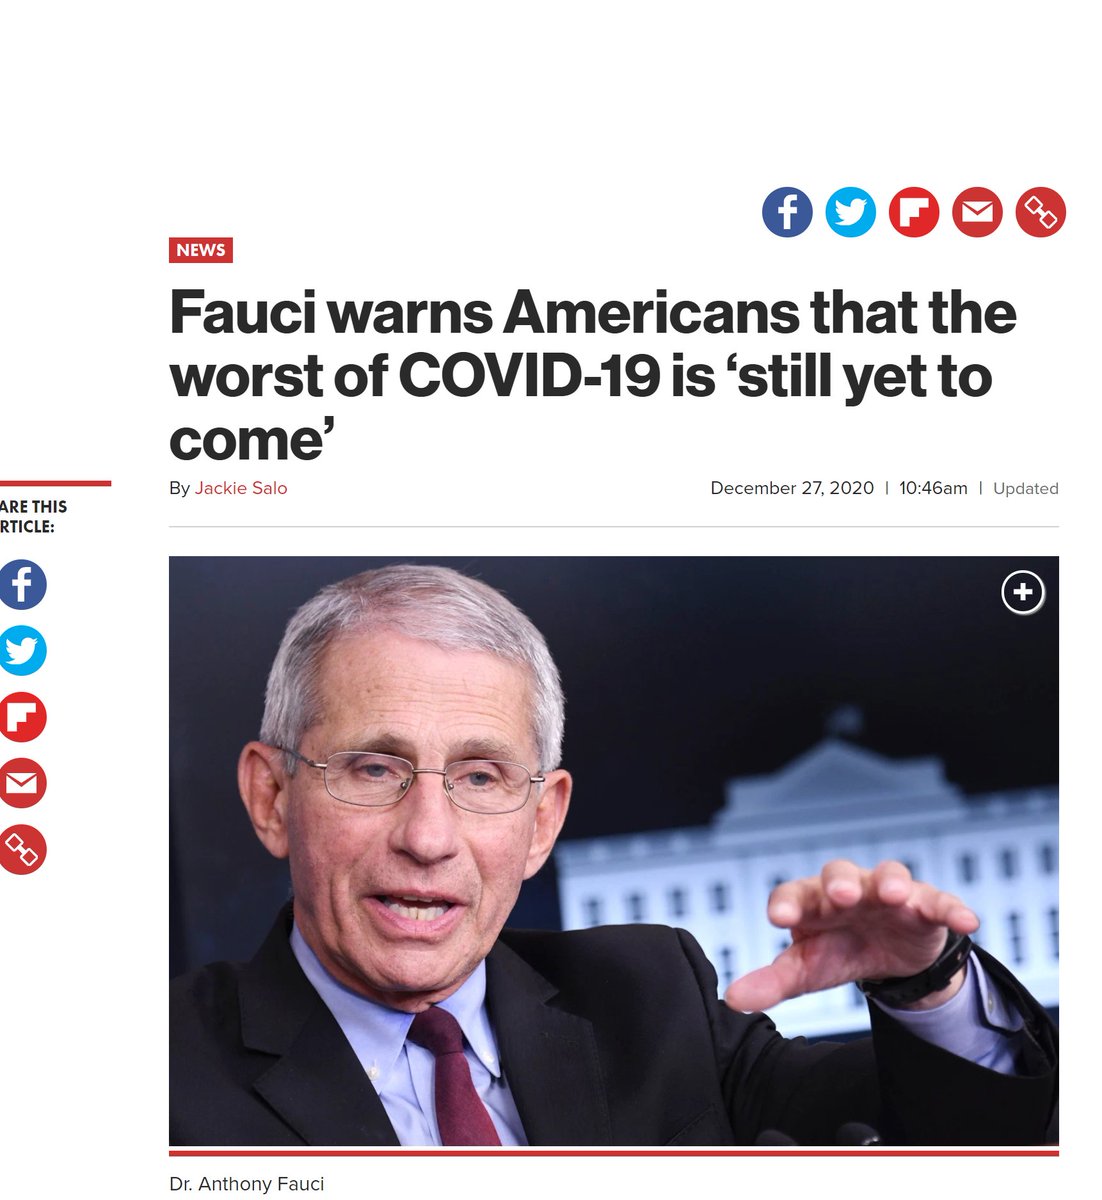
“If you look at the slope, the incline of cases we’ve experienced as we’ve got into the late fall and soon-to-be early winter, it really is quite troubling" said anthony fauci.
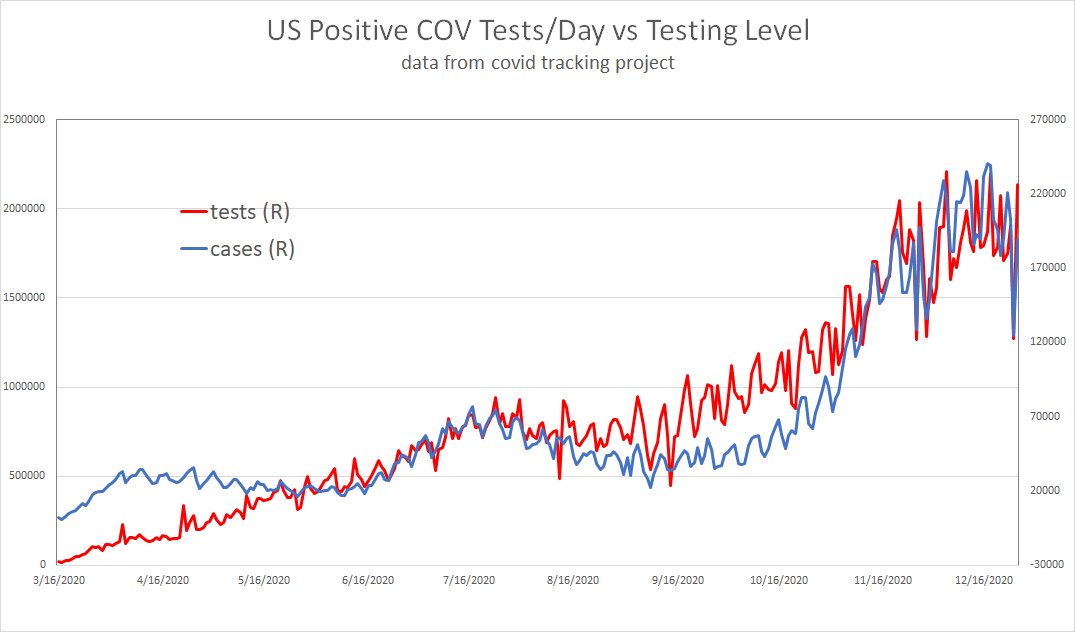
as ever, he's just plain wrong. he is, once more, reporting "cases" without regard to testing levels.
as ever, he's just plain wrong. he is, once more, reporting "cases" without regard to testing levels.
fauci is flat out making up his data AND his facts.
this endless refusal to realize that how much you test (sample rate) any given population determines how many "cases" you report even if your tests are accurate (and they aren't) is outrageous
consider the "thanksgiving surge"
this endless refusal to realize that how much you test (sample rate) any given population determines how many "cases" you report even if your tests are accurate (and they aren't) is outrageous
consider the "thanksgiving surge"
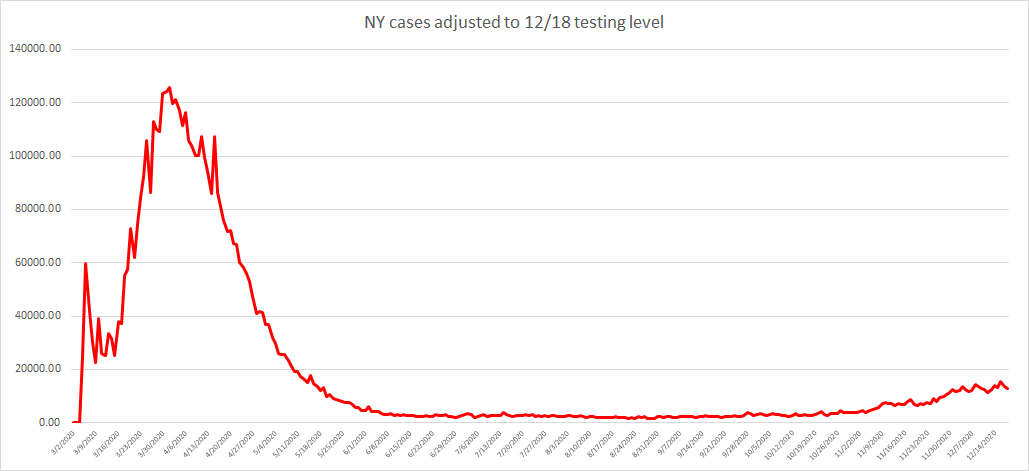
as can be readily seen, once you adjust for testing levels, there is no thanksgiving surge to speak of.
we've been in a tight range since 11/10 with a 12/2 peak slightly higher than the day before thanksgiving.
we've been in a tight range since 11/10 with a 12/2 peak slightly higher than the day before thanksgiving.
people seem to get confused about what's being done here so let me lay it out simply: i'm not saying cases today are 24k. i'm saying that if were were testing at the same level we were on the 4/25 peak, we'd be showing 24k cases.
reality is probably more like this.
reality is probably more like this.
it's showing the same thing, i just think it's easier to see the other way how badly "raw" cases affect the trend. they have flat out reversed its slope.
in % terms they peaked at 664% of apr peak on 12/18
adjusted for sample rate they were 45% that value then.
in % terms they peaked at 664% of apr peak on 12/18
adjusted for sample rate they were 45% that value then.
the simplest way to think about this is imagine counting red cars on the highway. you cannot count them all.
there are 10 million cars. 500k are red. 5%.
if you sample 100k cars, you get 5k red ones.
if you sample 200k, 10k. so "raw" doubles.
but prevalence was identical.
there are 10 million cars. 500k are red. 5%.
if you sample 100k cars, you get 5k red ones.
if you sample 200k, 10k. so "raw" doubles.
but prevalence was identical.
this is why testing rate matters. if you test any given group twice as much, you'll find 2X as many cases (assuming your samples are representative, and testing has been so high that this has been so since apr)
we can quibble, but it's FAR better than raw
they line up tightly
we can quibble, but it's FAR better than raw
they line up tightly
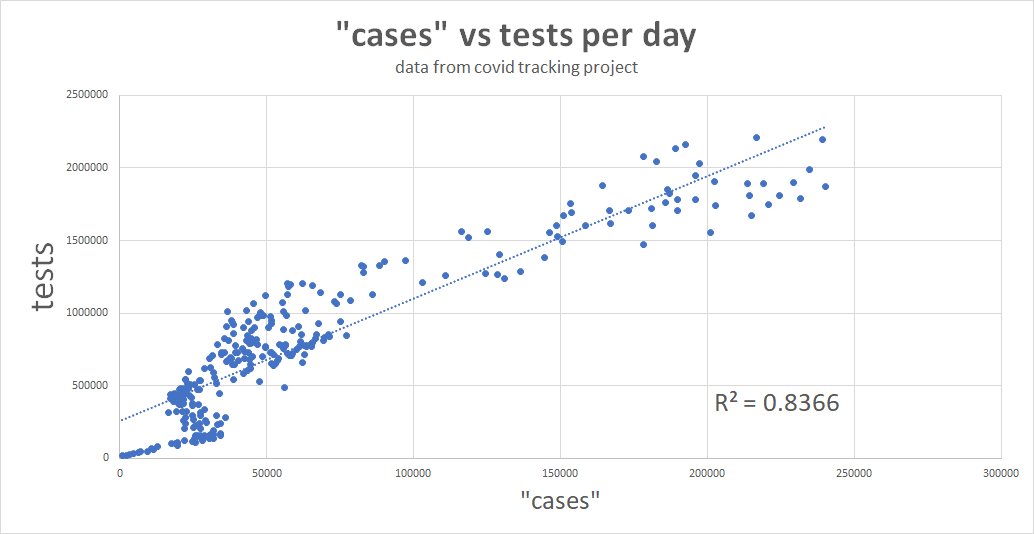
positive tests/day have a 0.84 R2 with tests/day.
that implies that 84% of "reported cases" value is predicted just from testing level (sample rate)
anyone who wants to argue that my methodology is not pretty close to correct had best have a good alternate explanation for that.
that implies that 84% of "reported cases" value is predicted just from testing level (sample rate)
anyone who wants to argue that my methodology is not pretty close to correct had best have a good alternate explanation for that.
but even these adjusted numbers are likely significantly overstated as referring to a PCR+ as a "case" when such testing picks up so much non clinical trace RNA leads to massive overcounting. https://twitter.com/boriquagato/status/1330277330128936960?s=20
there is a reason that the FDA and the major drug companies do not accept a PCR+ alone as proof of a case in vaccine trials.
they demand symptomatic confirmation.
not to do so makes the data unreliable. https://twitter.com/boriquagato/status/1308451578869809152?s=20
they demand symptomatic confirmation.
not to do so makes the data unreliable. https://twitter.com/boriquagato/status/1308451578869809152?s=20
so, we're dealing with overcounting here and worse, we're dealing with data skew that will lead to more overcounting now vs april because there are more recovered individuals and more trace/endemic virus.
the skew is predictable, its magnitude is not.
this makes for messy data.
the skew is predictable, its magnitude is not.
this makes for messy data.
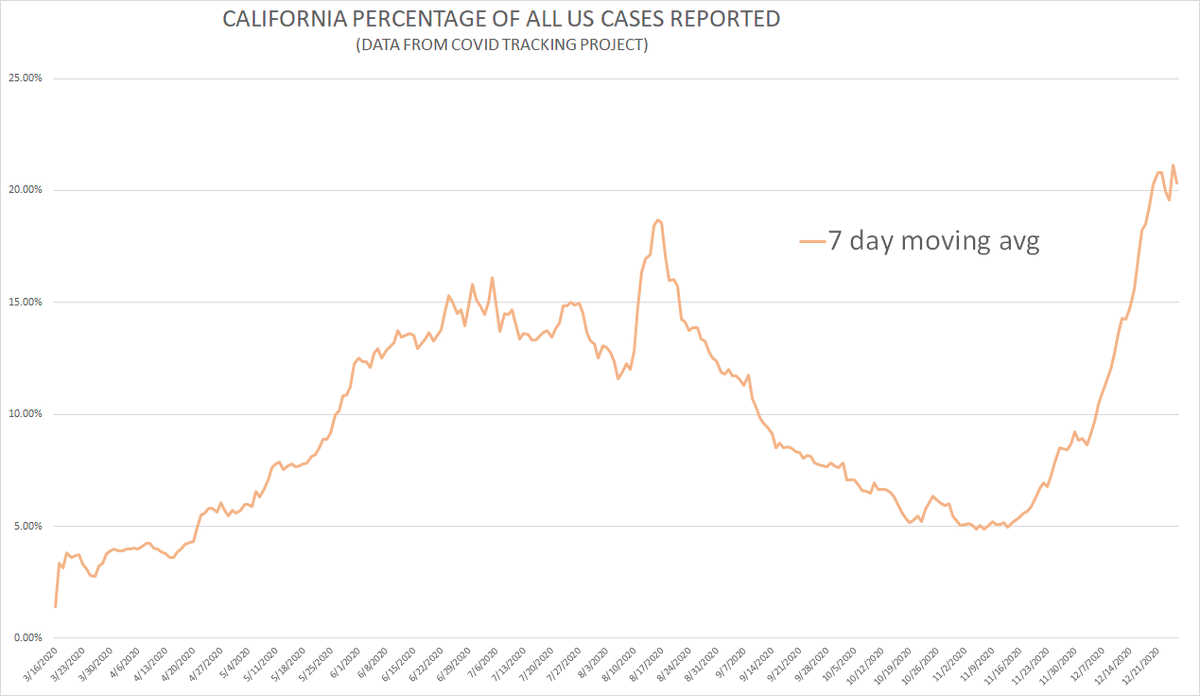
some other interesting outcomes here that track seasonality. most states are now in decline on adj basis/deaths. increasingly, it's just california driving the rise.
they are ~21% of all new "cases" for the whole US.
they are ~21% of all new "cases" for the whole US.
covid trends have been regional/seasonal and double peaks rare.
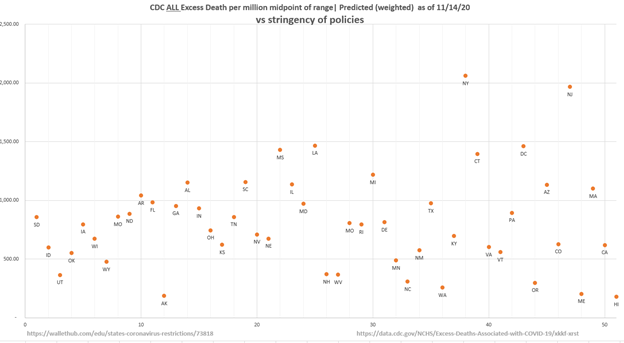
lockdowns, masks, distancing, travel bans, and school closures have simply had no effect. https://twitter.com/boriquagato/status/1336294261193641985?s=20
lockdowns, masks, distancing, travel bans, and school closures have simply had no effect. https://twitter.com/boriquagato/status/1336294261193641985?s=20
certain internet felines have been showing this in various ways since apr/may, but this is now so clearly visible in the full excess deaths figures as to be pretty much undeniable.
i have yet to see any remotely valid looking data that lockdowns or masks work on societal scale.
i have yet to see any remotely valid looking data that lockdowns or masks work on societal scale.
so take all the fauci histrionics about a surge within a surge from christmas with a full shaker of salt (and perhaps tequila with lime) because the man is lying, was wrong about thanksgiving, and is determined to stay on TV, gain NIH budget, and carry water for vaccine companies
the overall evidence that we're FAR below april peak and the worst is long behind us looks more than compelling
the case that the worst is yet to come looks ridiculous and unsupportable
fauci is a corrupt astrologer, not a scientist and he does NOT have your interests at heart
the case that the worst is yet to come looks ridiculous and unsupportable
fauci is a corrupt astrologer, not a scientist and he does NOT have your interests at heart

 Read on Twitter


