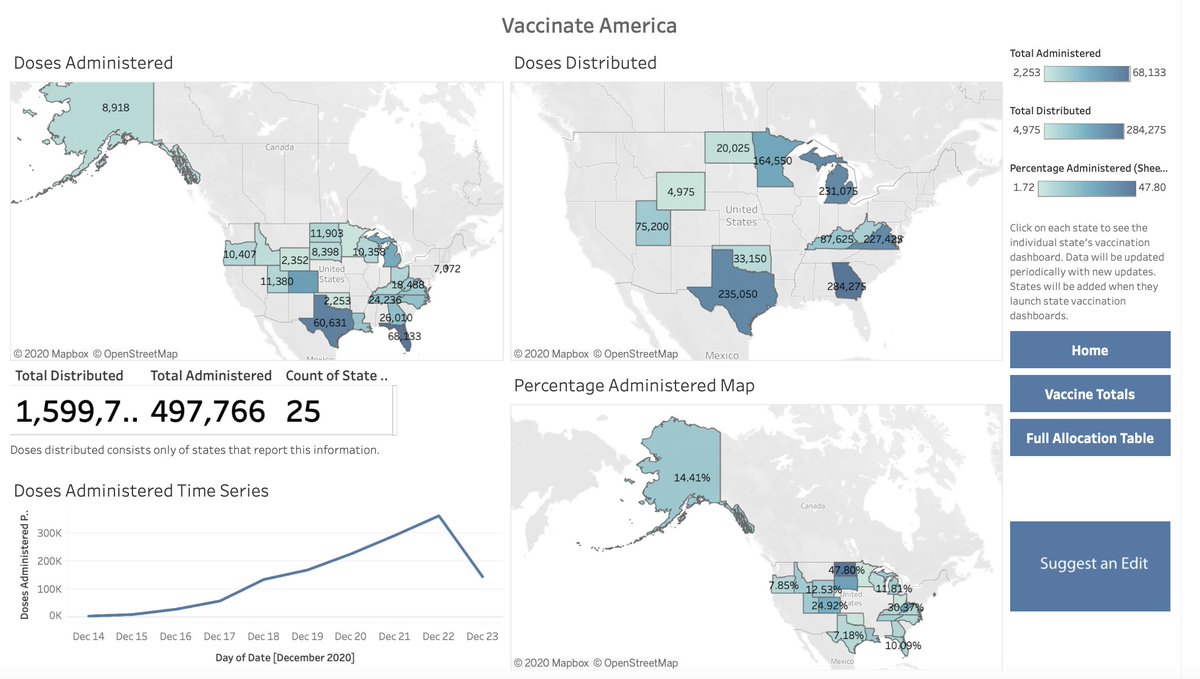
Tonight's #VaccinateAmerica dashboard update: 25 jurisdictions have released vaccine dashboards with a total of 497,766 doses administered. This is 49.4% of the CDC's 1,008,025 reported doses on its dashboard.
https://public.tableau.com/views/COVID-19VaccineAllocationDashboard/Dashboard1?:language=en&:display_count=y&publish=yes&:origin=viz_share_link
https://public.tableau.com/views/COVID-19VaccineAllocationDashboard/Dashboard1?:language=en&:display_count=y&publish=yes&:origin=viz_share_link
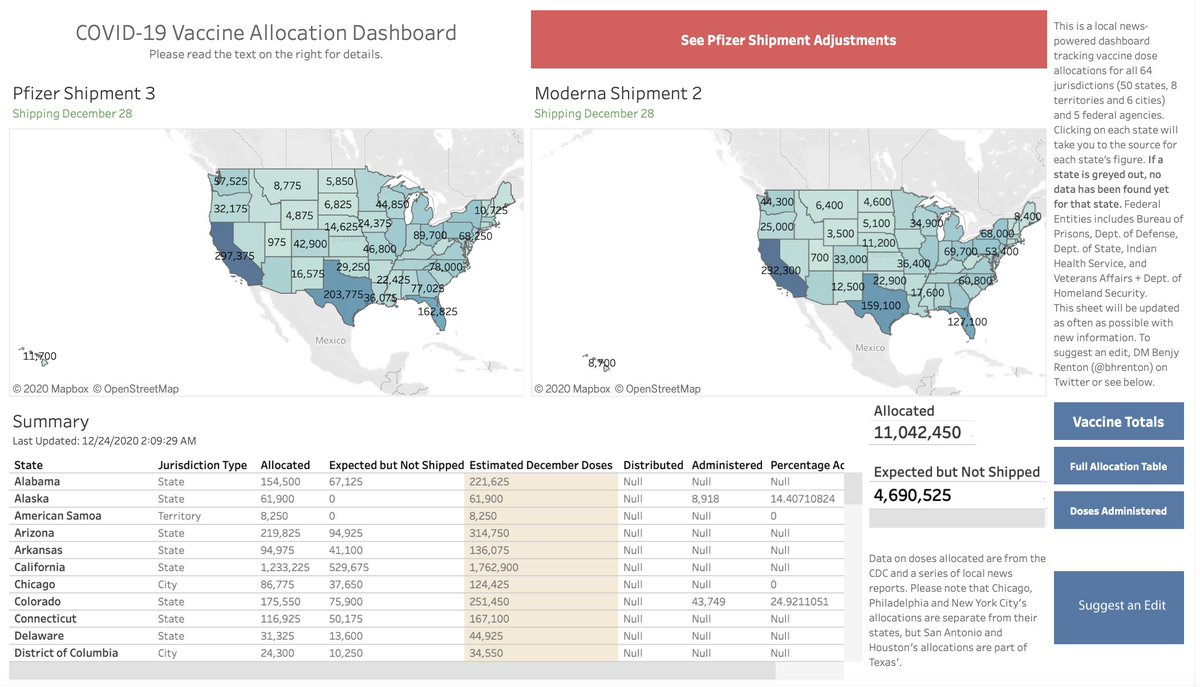
As mentioned earlier, OWS has issued the latest dose allocations for next week's shipments, which are mapped below.
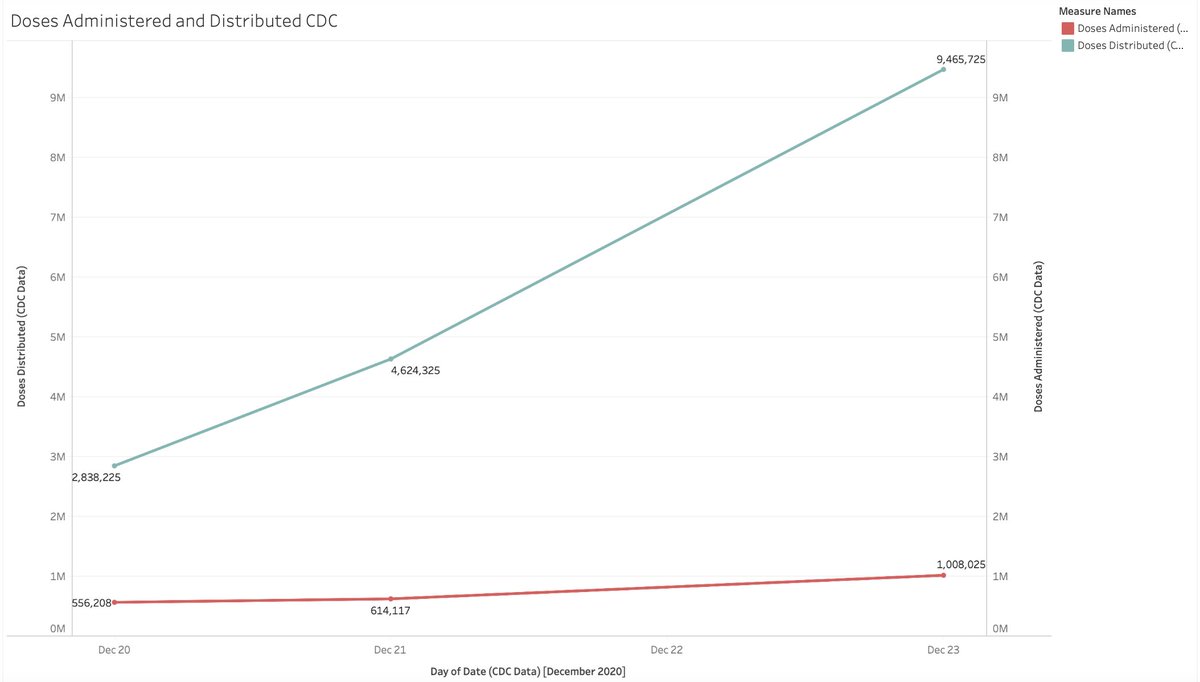
A new visualization will be formally launched on the Dashboard shortly which shows the CDC data over time. Currently, 10.6% of the doses distributed have been administered. While doses administered take longer to report than distributed, this will be a major issue going forward.
Good thread on reporting issues here: https://twitter.com/joshmich/status/1341424703311908867
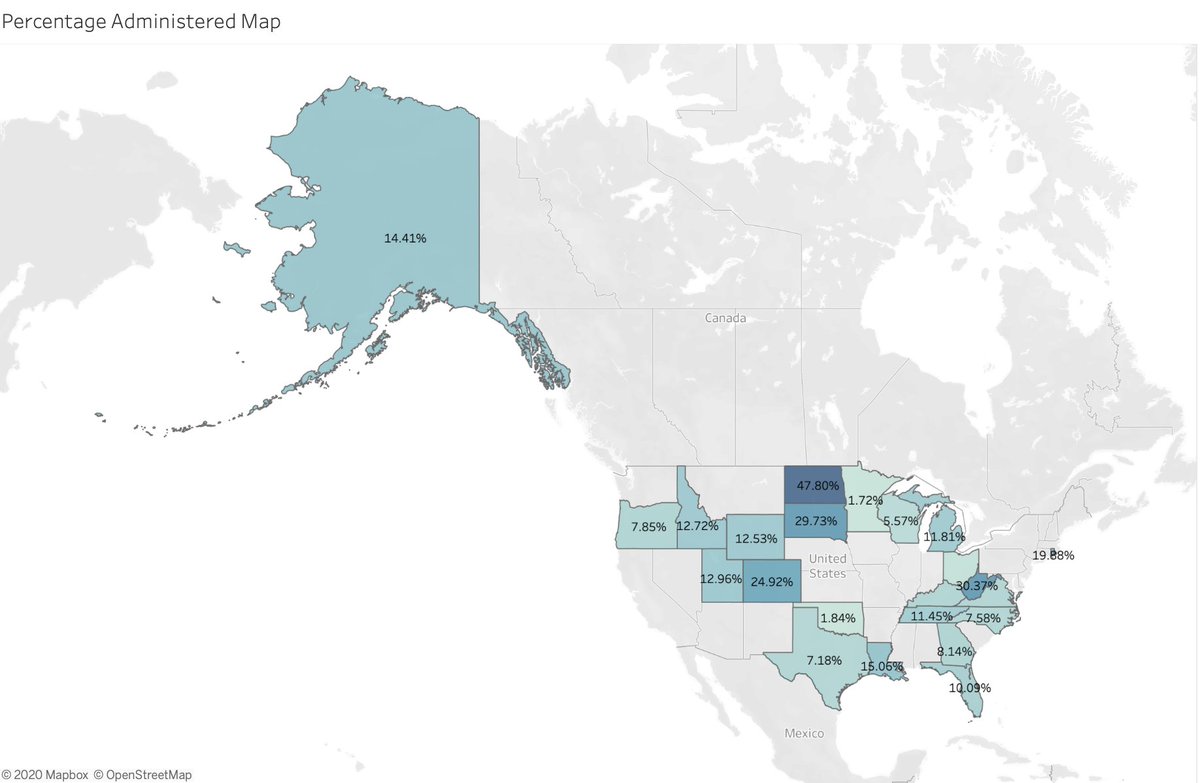
Here is a map with the percentage of doses allocated that have been administered. The average percentage of doses administered from these states is 20%.

 Read on Twitter


