[Thread] Great visualisation by @media_hack of the daily confirmed #COVID19SA cases since March and how the number of cases changed during different levels of #lockdown. See the sharp increase in December during Level 1. 1/5
These charts show the 7-day average of daily new #COVID19 cases in provinces over the past 8 months. In WC that average is now higher than at the peak of the 1st wave. Total active infections in WC now stand at 34 694, 61% higher than the 1st peak: https://bit.ly/3aBSnvK . 2/5
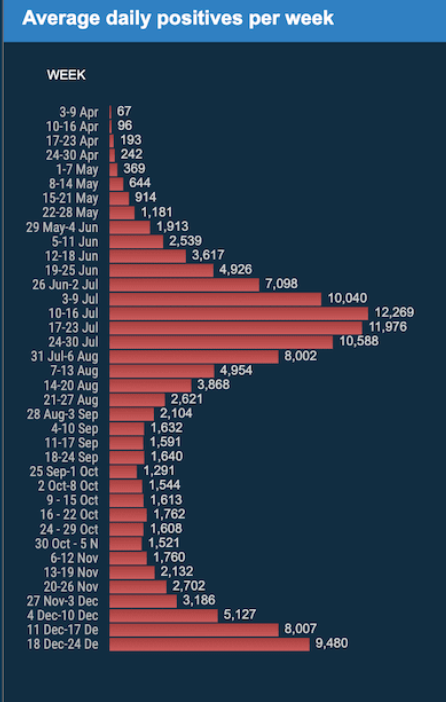
Here's how the average daily positives per week have changed since March. July 10-16 saw the most + at 12 269. We're now almost back at levels of early July (the week before July 10). Note: figures for this week (av = 9 480) aren't complete because the week hasn't yet ended. 3/5
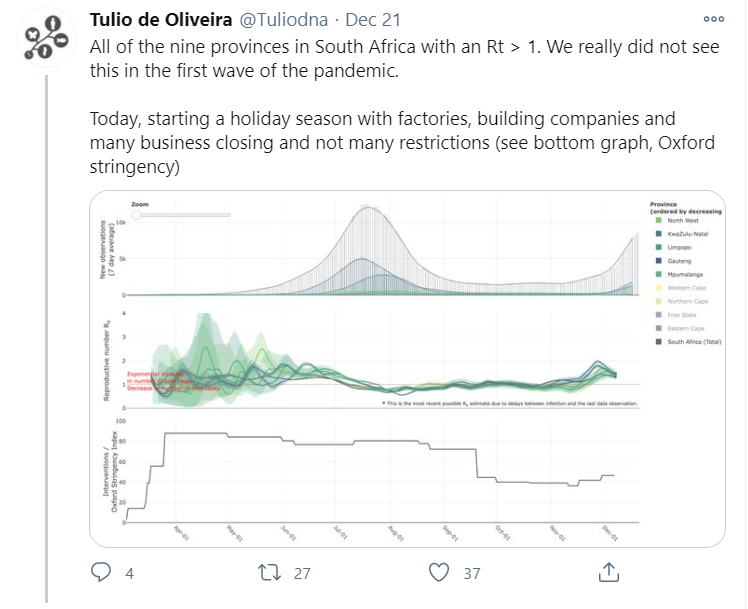
As @Tuliodna has pointed out: What's different about the 2nd #Covid19SA wave vs. the 1st wave is that all 9 provinces have a R value bigger than 1. (R = average number of people that one infected person will pass on the virus to; above 1 = leads to exponential growth). 4/5
And, we of course, have a new SARS-CoV-2 (the virus that causes #COVID19) variant dominating the second wave. One — preliminary data suggests — that is spreading faster than the virus in the the first wave. https://bit.ly/3mRvp6p 5/5

 Read on Twitter
![[Thread] Great visualisation by @media_hack of the daily confirmed #COVID19SA cases since March and how the number of cases changed during different levels of #lockdown. See the sharp increase in December during Level 1. 1/5 [Thread] Great visualisation by @media_hack of the daily confirmed #COVID19SA cases since March and how the number of cases changed during different levels of #lockdown. See the sharp increase in December during Level 1. 1/5](https://pbs.twimg.com/media/Ep5xY-CXMAEFisI.jpg)


