1/ So lot has been talked about the latest EoY run in #uranium equities (for good reason) b/c they are either playing catchup to S/D news or (more likely imo) fund flows. But I want to talk spot & framework of interpreting the cycle.
2/ Actually, I don't care about #U3O8 spot, I care about LT contracts since that is what economically matters to the industry. I only care about spot as a signal to us for timeframe of uts incentives. I'm just a student, lmk what you think.
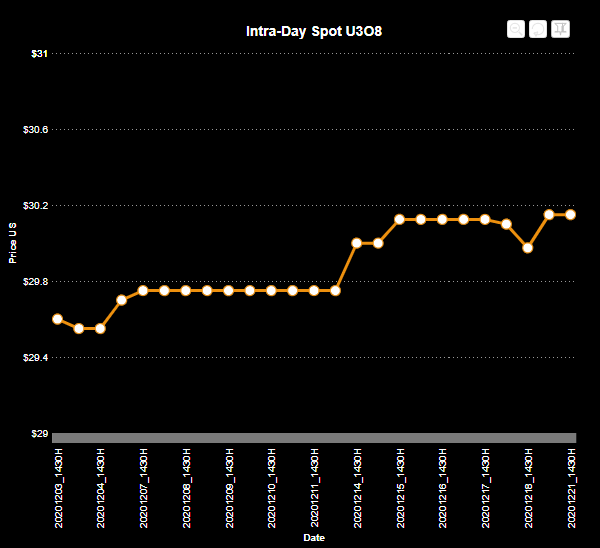
3/ First the simple observations: For the Dec, Spot has increased ~1.86%. Definitely not celebratory worthy, but I will take consistent marginal improvement every time.
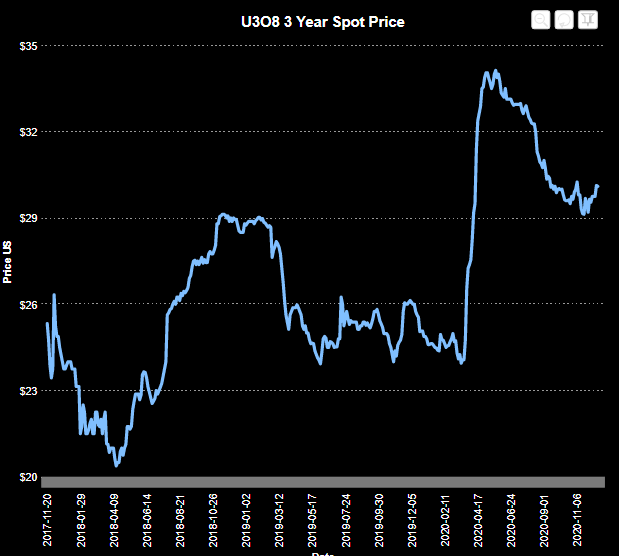
4/ Slightly more noteworthy, Spot has finally established some sort of resistance w/minor uptick in vol at ~$30 after flailing downward from late March/early April boom. Like i said, simple.
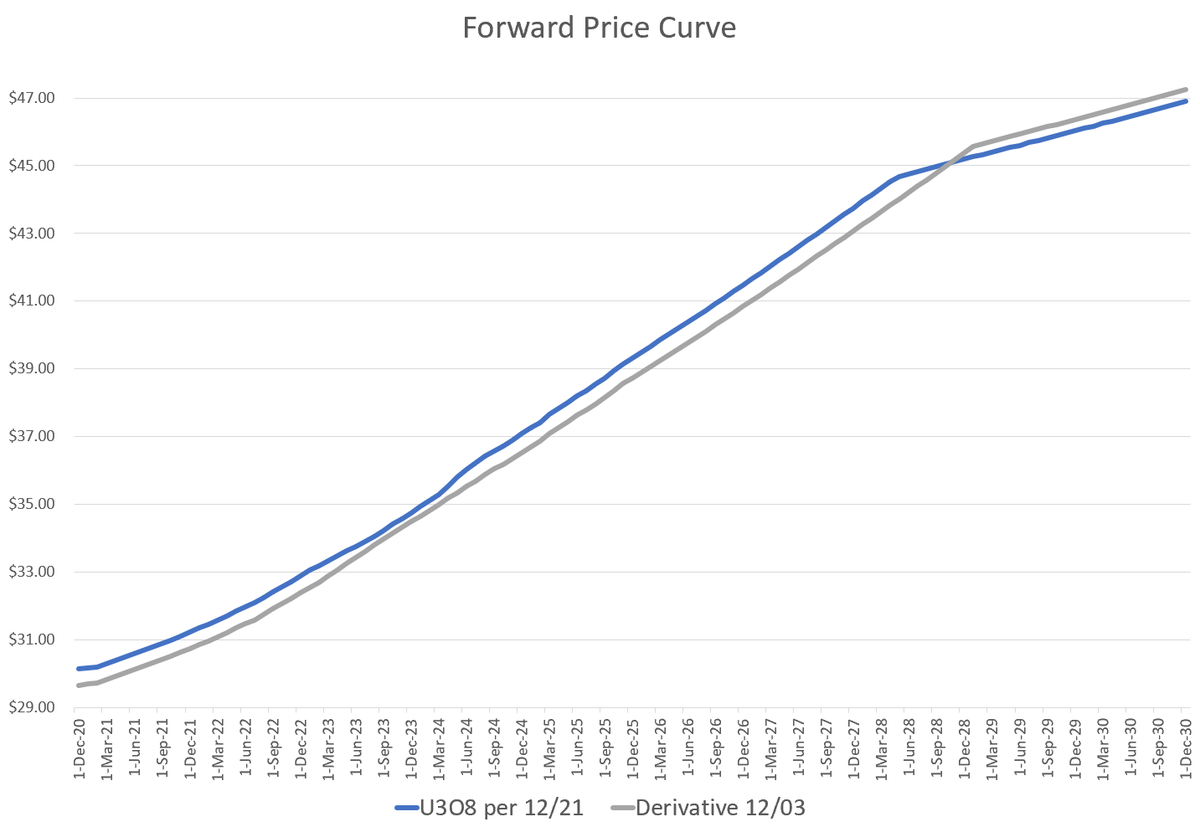
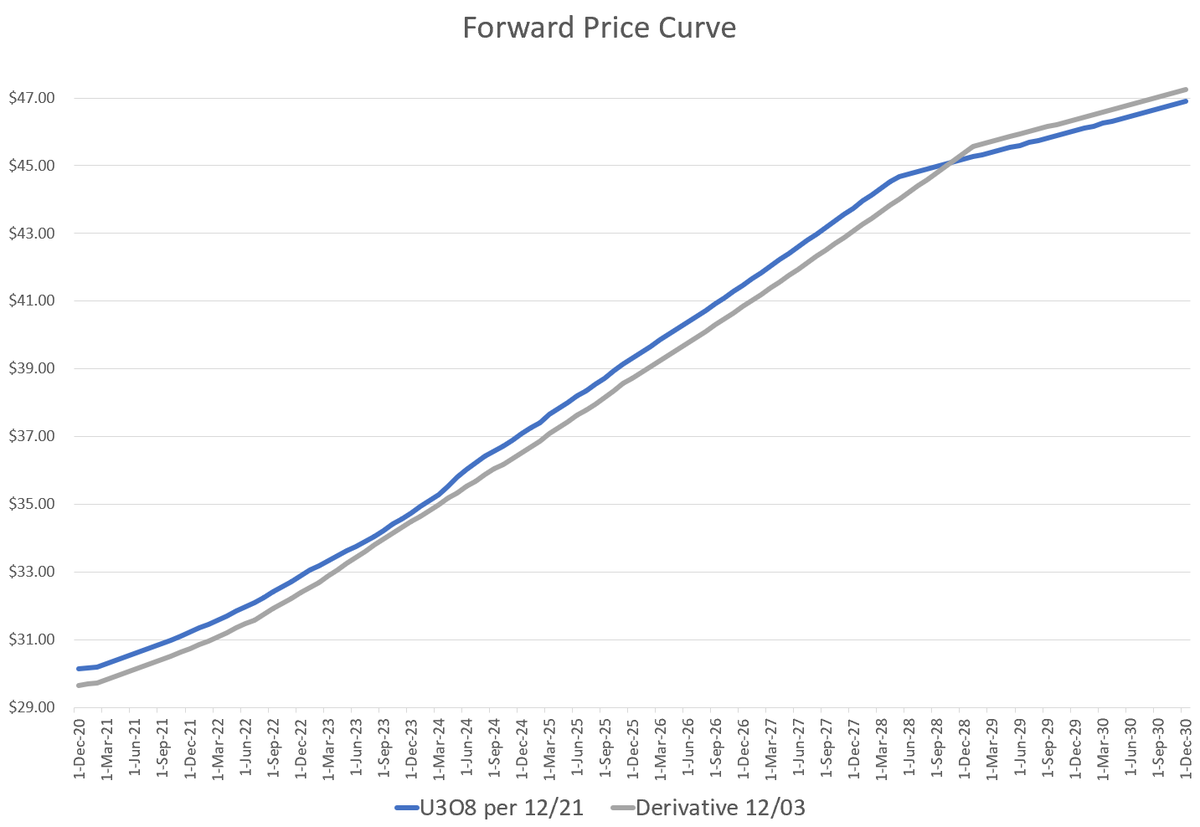
5/ More important is the Forward Price Curve compared w/LT trend. This might be a helpful reminder to combat the phycological pressure to not secure a profit midway in the cycle during a temporary trend reversal.
6/ Obviously, we all want the blue line to keep going up. But what we really want is an inversion event & frwd curve may indicate subtleties to the cycles form leading up. 1st is the compression of the normal curve to be more elastic. The consistent narrative is prices need
7/ to be economical to restart mines. Tracking this comp will be a good tell for when uts actually are price incentivized to enter LT contracts. Not negotiate, commit, b/c sellers have no more patience. The slowness of LT contract vol has often been complained: How can the
8/ uts not see S/D issue & act? I don't work in energy but I am in supply chain. Justifying to mgmt significantly higher price commits is difficult w/o current pricing data validating the thesis b/c mgmt is conditioned to the environment of the yesteryear carry trade.
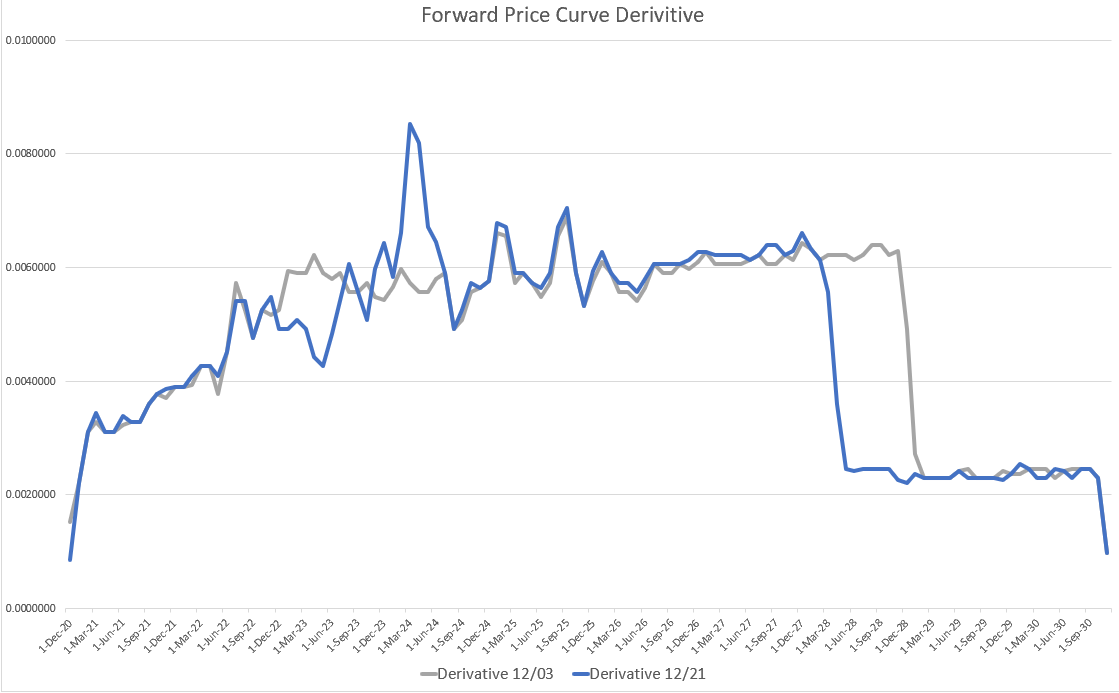
9/ So the process of LT RFQs will have to prove what is currently not in the frwd curve & LT will lead the rise in prices. With spot lagging LT, we will look for proof the curve's derivative is pushed down & compressed. Not much change EoY while resistance was reestablished.
10/ The only exception is at this knee way in the future. Just in Dec, the hard knee moved up the graph ~3 qtrs. Have to wonder if a consistent shift will pressure vol for an inversion event.
11/ As long as this knee is shifting, I think it is another signal uts are increasingly incentivized to commit to LT contracts. Uts need to secure lbs yrs ahead, this knee will signal uts have less time in LT contracting cycle.
12/ So what I am uncertain: before the hurrah in spot occurs & surpasses LT, how much norm curve compression or shift of hard knee indicates LT contracting is exhausted & snap the curve into inversion?
13/ In end tho, parabolic spot inversion will occur & uts will panic pleading with developers to hurry. So frwd price curve compared to LT pricing trends might be a fairly good indicator of cycle turnings to guide us in our positions. Stay Yellow.

 Read on Twitter