I had a request to look at transfer spend in the Premier League, so I have analysed this over the last 5 years (up to 2018/19, the last season when all clubs have published their accounts). As a Christmas bonus, I have also included the EFL Championship.
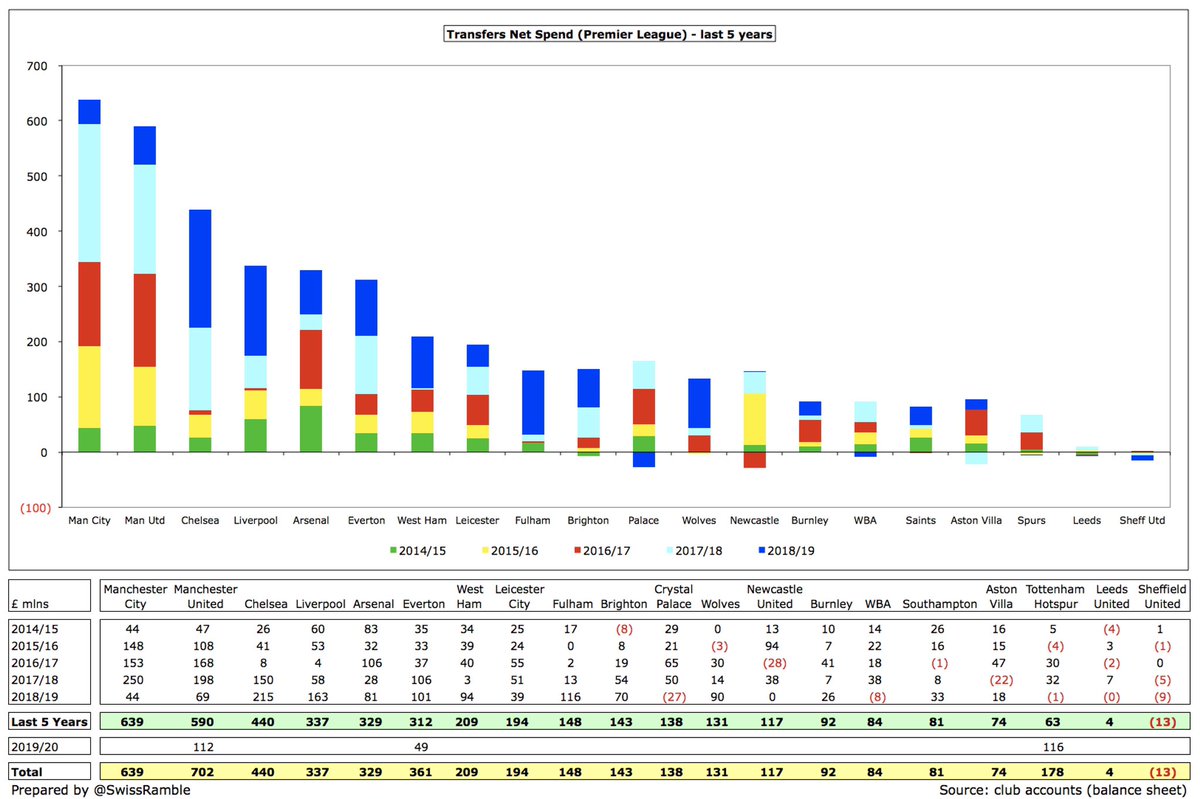
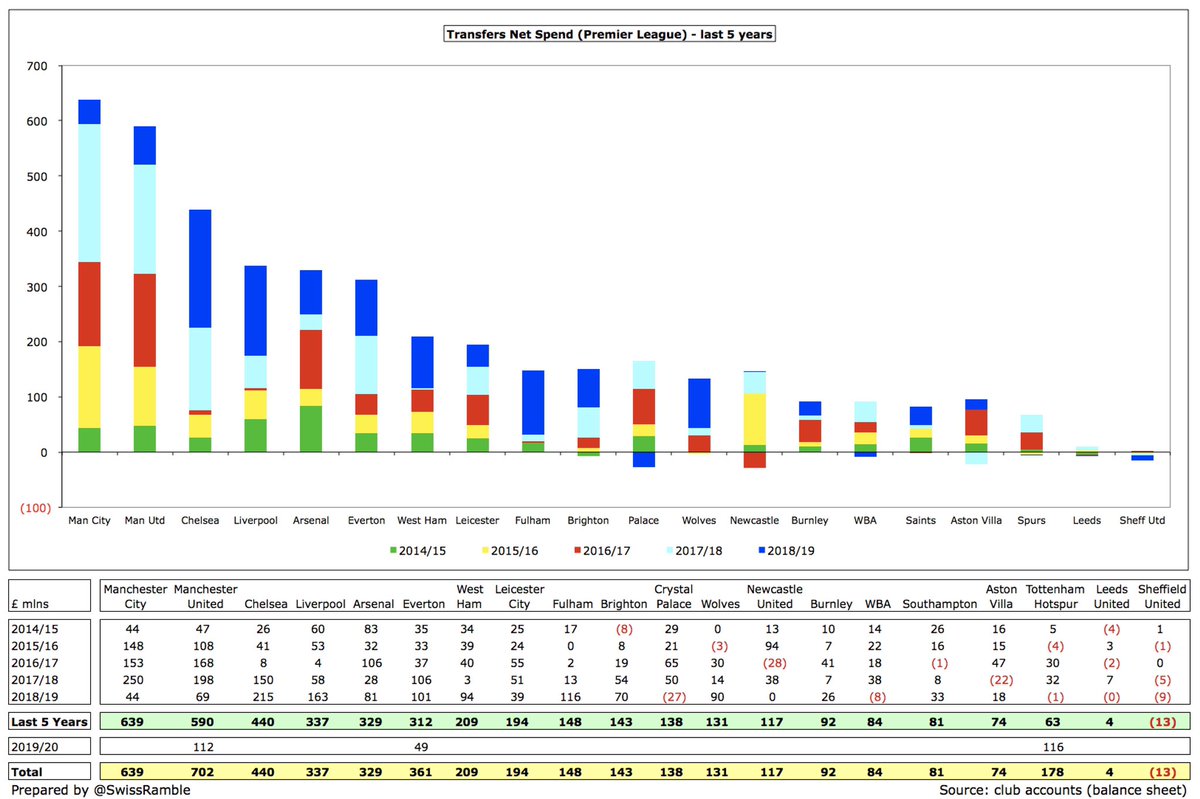
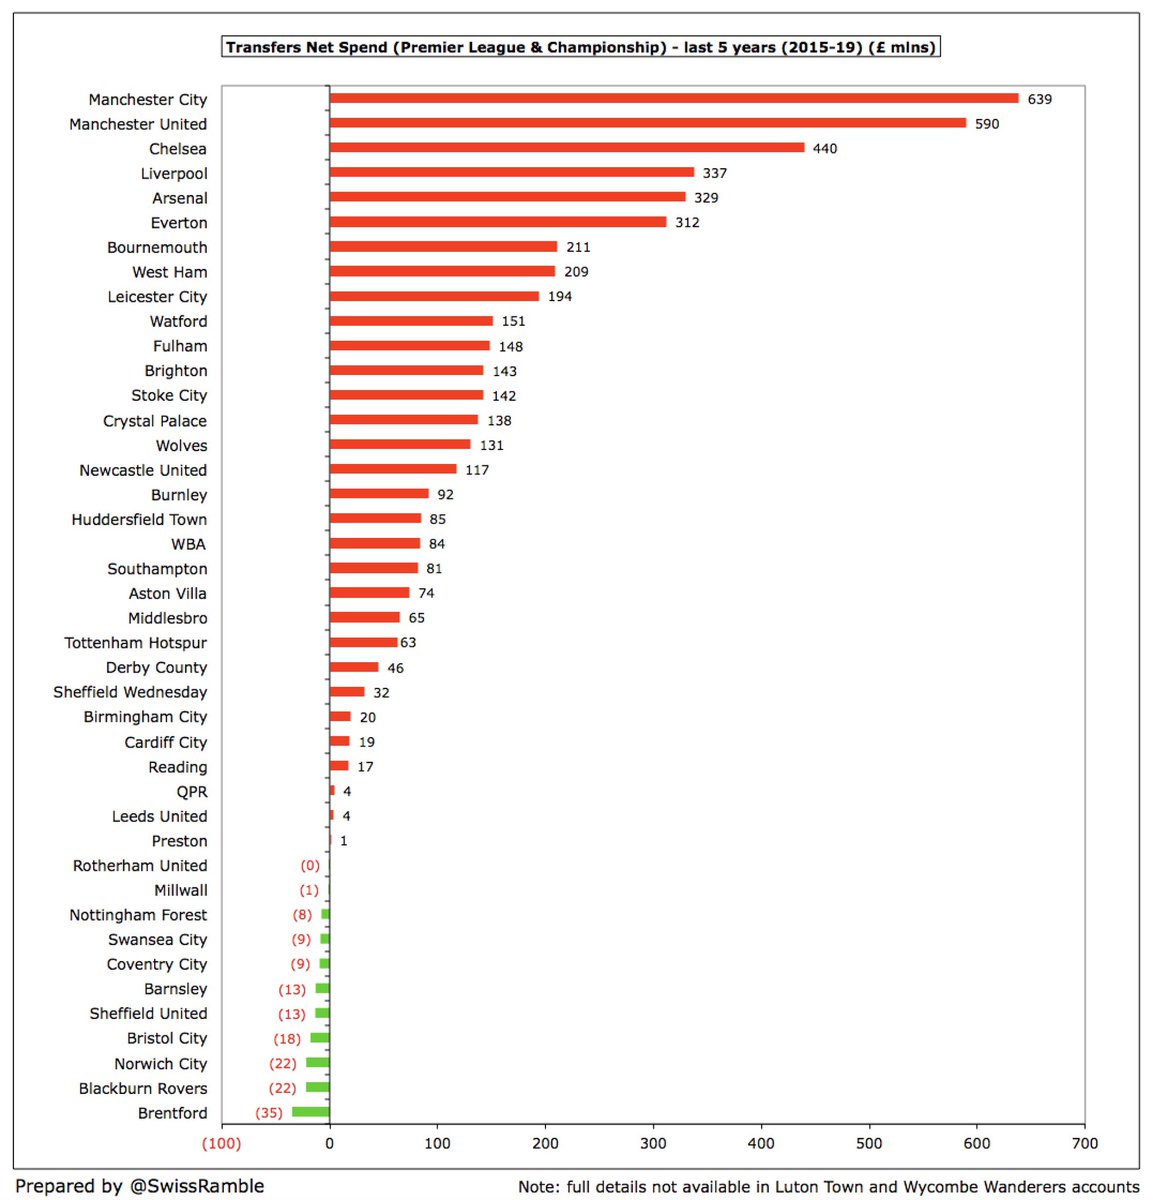
In terms of the infamous net spend, the two Manchester clubs have spent most on transfers ( #MCFC £639m and #MUFC £590m), followed by #CFC £440m. #AFC fans will be appalled to discover they have spent around the same (£329m) as champions #LFC £337m.
It is striking how low #THFC net spend was, only £63m in the 5 years up to 2018/19, though worth noting that they then splashed out £136m in 2019/20. Lowest spend unsurprisingly at clubs recently promoted from the Championship, i.e. #LUFC £4m and #SUFC £(13)m.
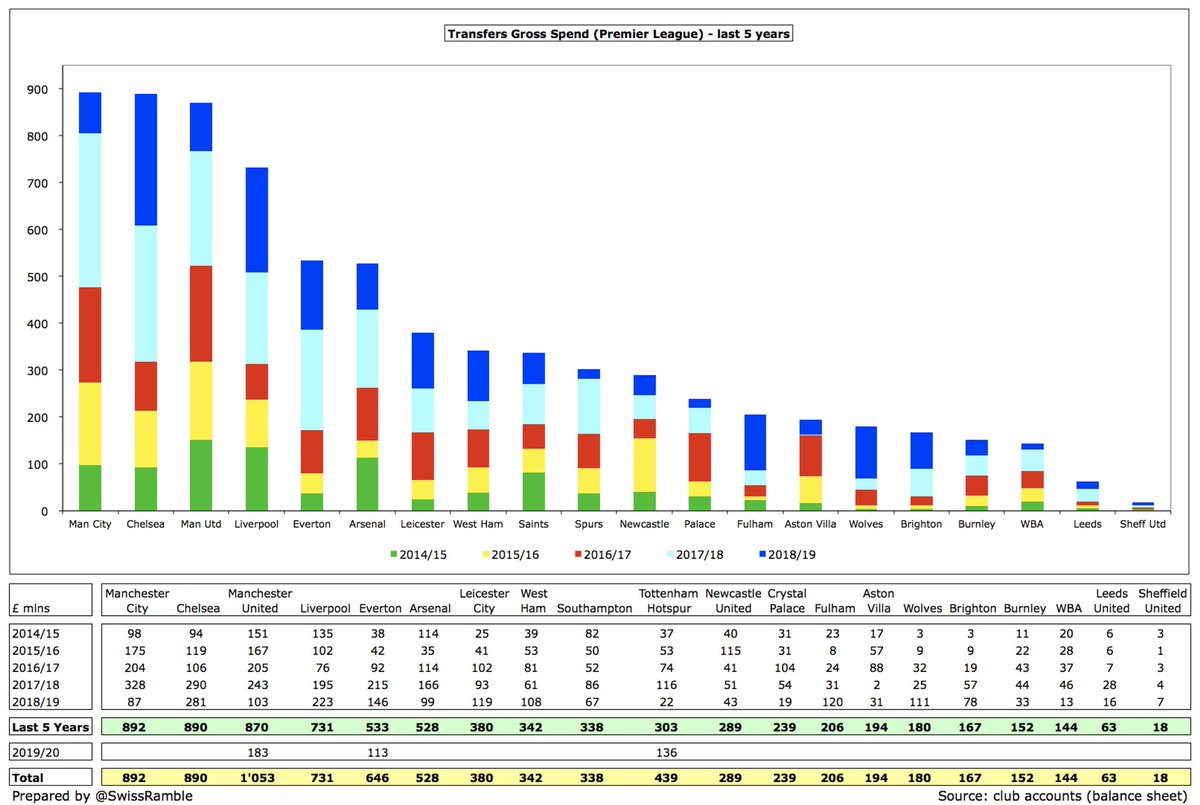
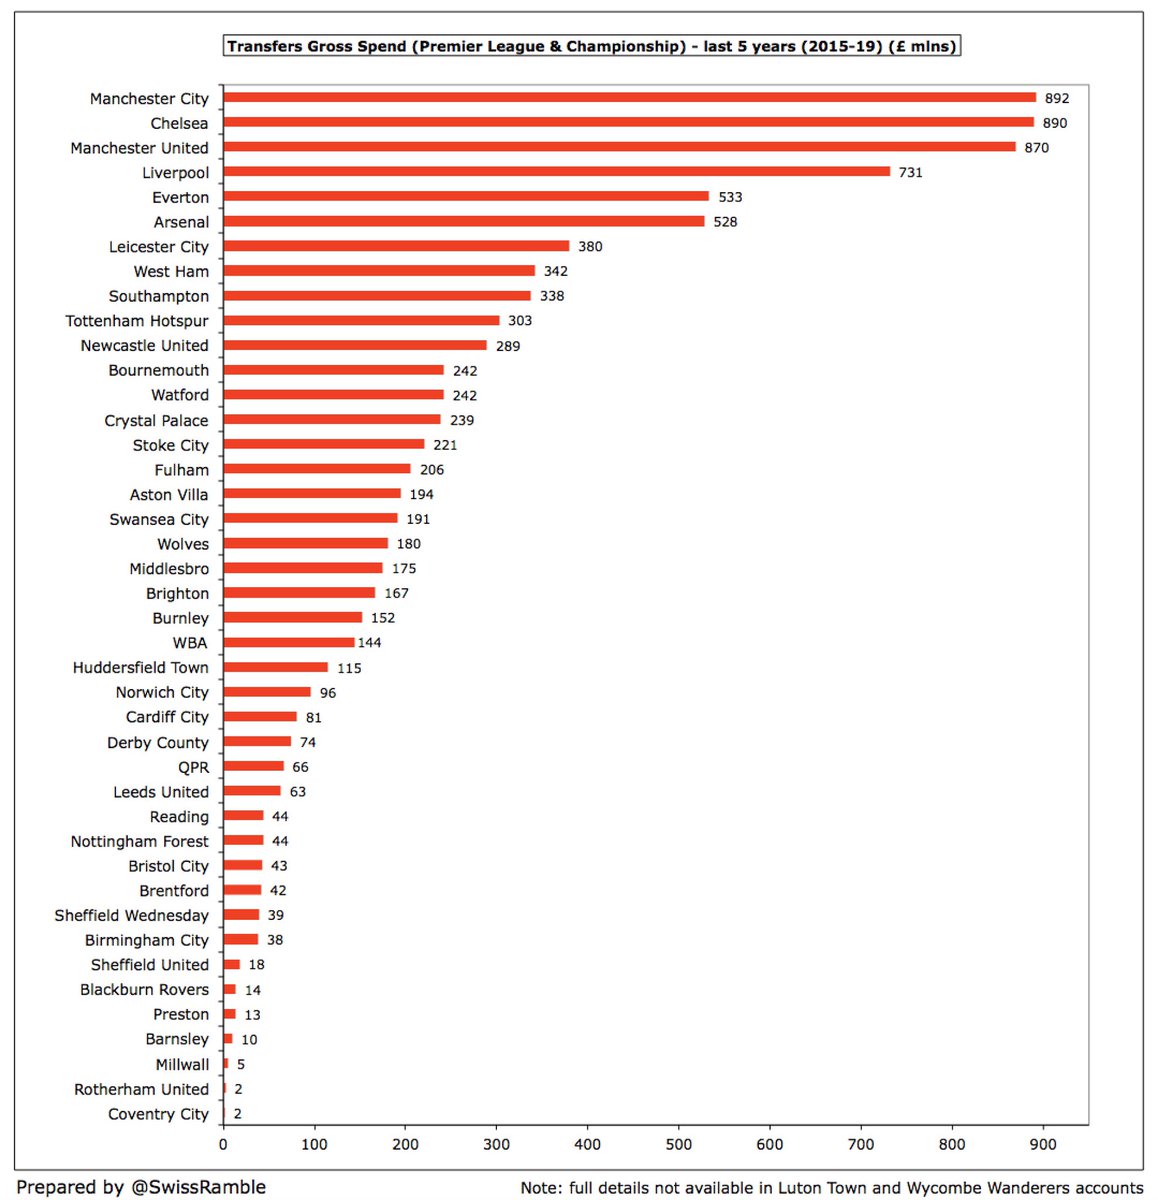
The picture is a bit different for gross transfer spend in the Premier League. #MCFC still lead the way with £892m, just ahead of #CFC £890m and #MUFC £870m. Next highest are the two Liverpool clubs, #LFC £731m and #EFC £533m, followed by #AFC £528m.
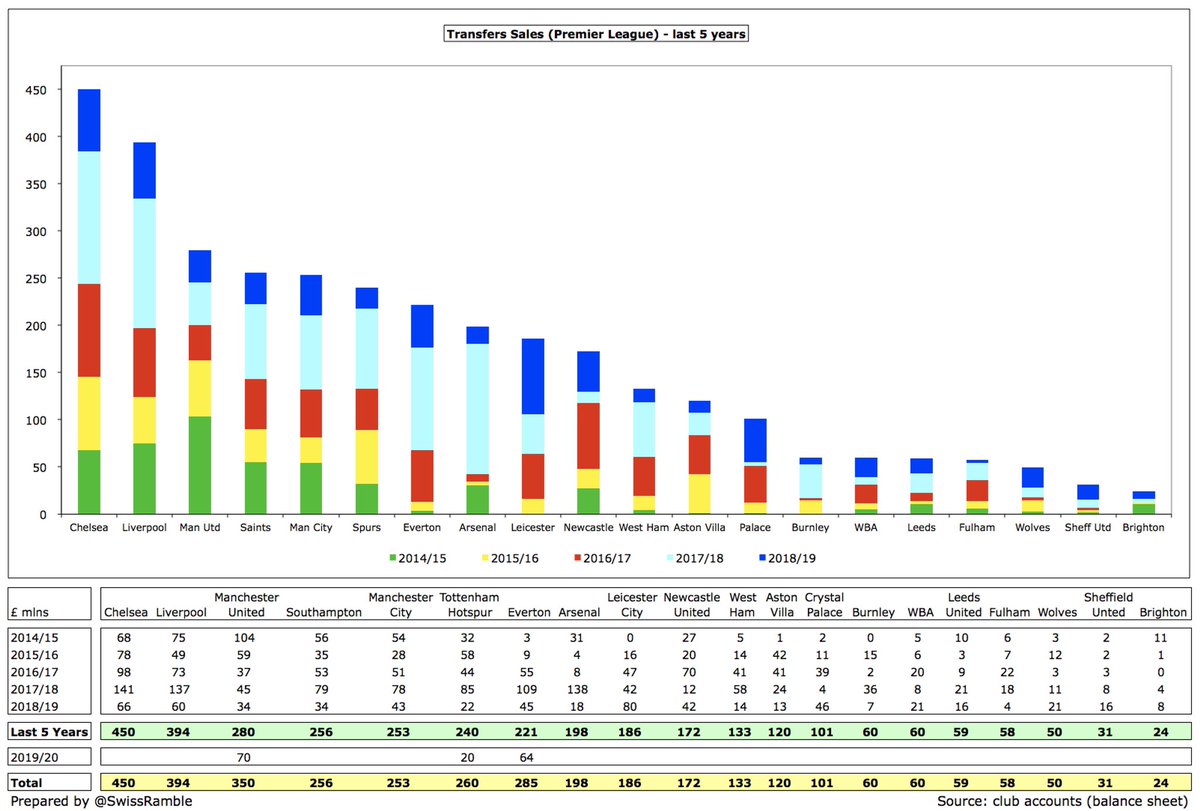
Highest transfer sales were #CFC £450m, in line with their business model, followed by #LFC £394m and #MUFC £280m. Next highest came #SaintsFC with an impressive £256m, which is in stark contrast to their South Coast peers #BHAFC, only £24m.
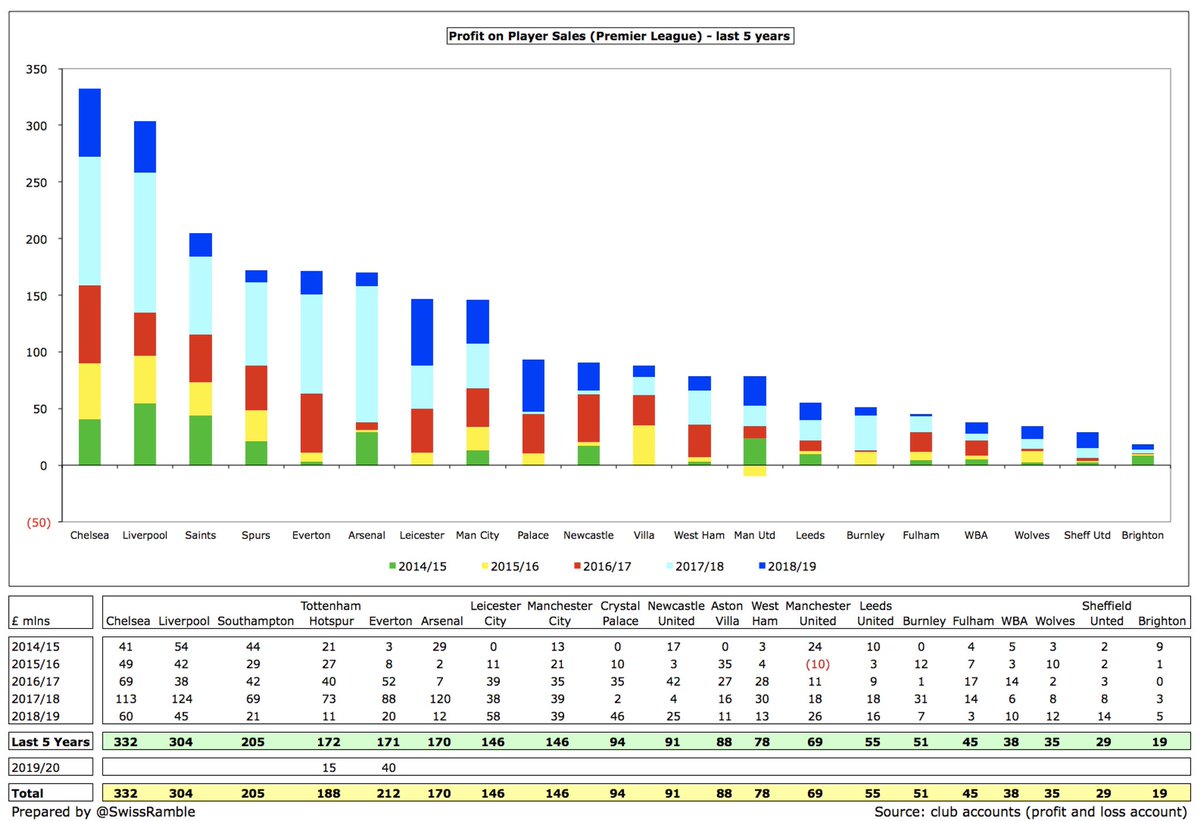
It is worth appreciating that profit on player sales can be very different from the value of the transfer. As one example, #MUFC shifted £280m of players in the 5 years up to 2018/19, the 3rd highest in the Premier League, but their profit was only £69m, 13th highest in the PL.
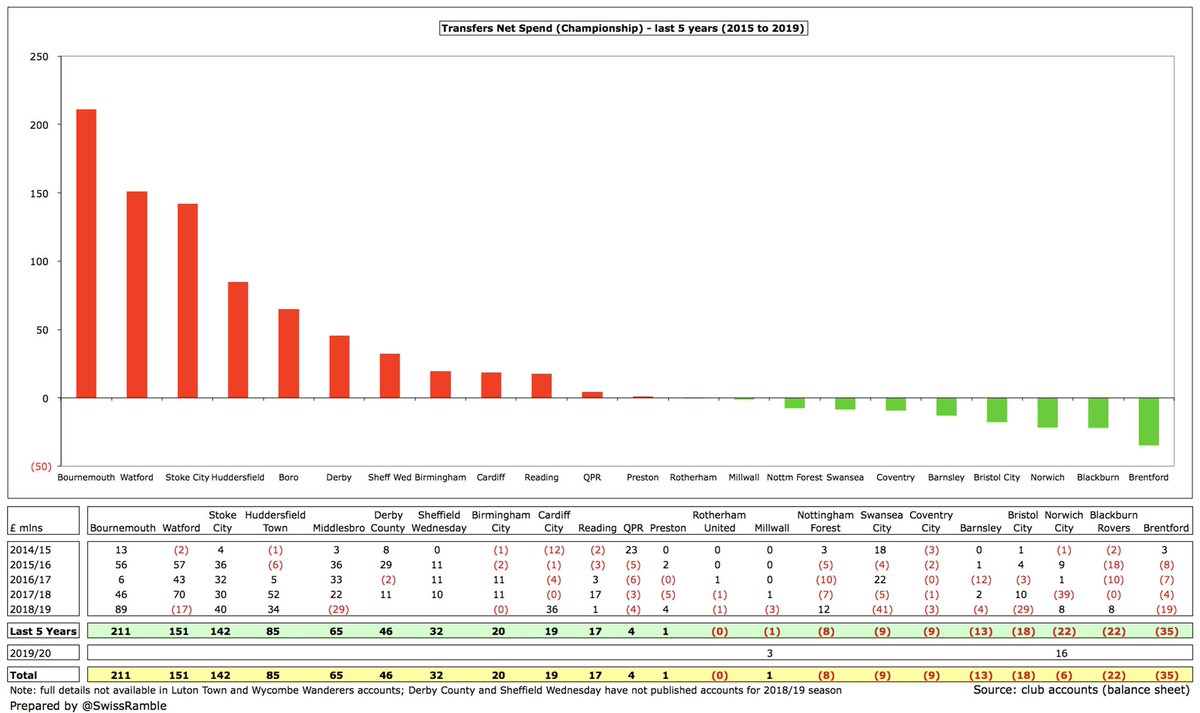
Highest net spend in the Championship predictably from clubs that were recently in the top flight: #AFCB £211m, #WatfordFC £151m, #SCFC £142m, #HTAFC £85m and #Boro £65m. Almost half of the clubs reported net sales, led by #BrentfordFC £35m.
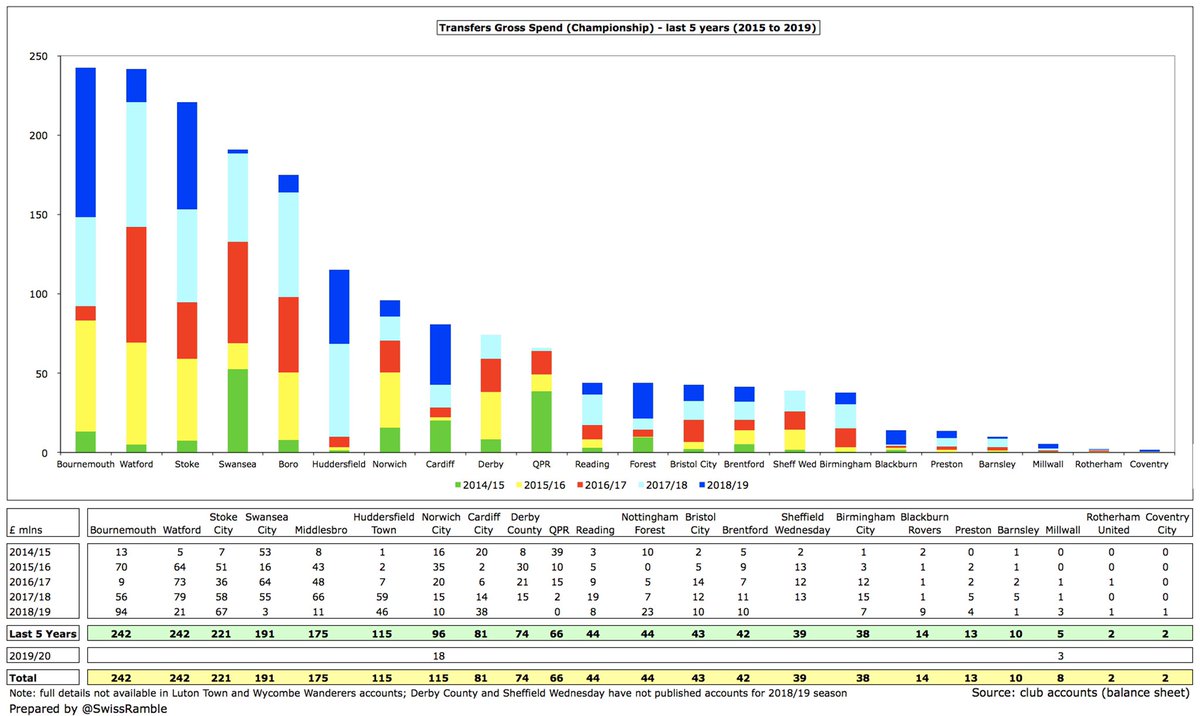
Gross transfer spend is similar with the highest at #AFCB and #WatfordFC both £242m, followed by #SCFC £221m, though #Swans were next with £191m. Note: #DCFC and #SWFC have not yet published accounts for 2018/19, so their figures only cover 4 years.
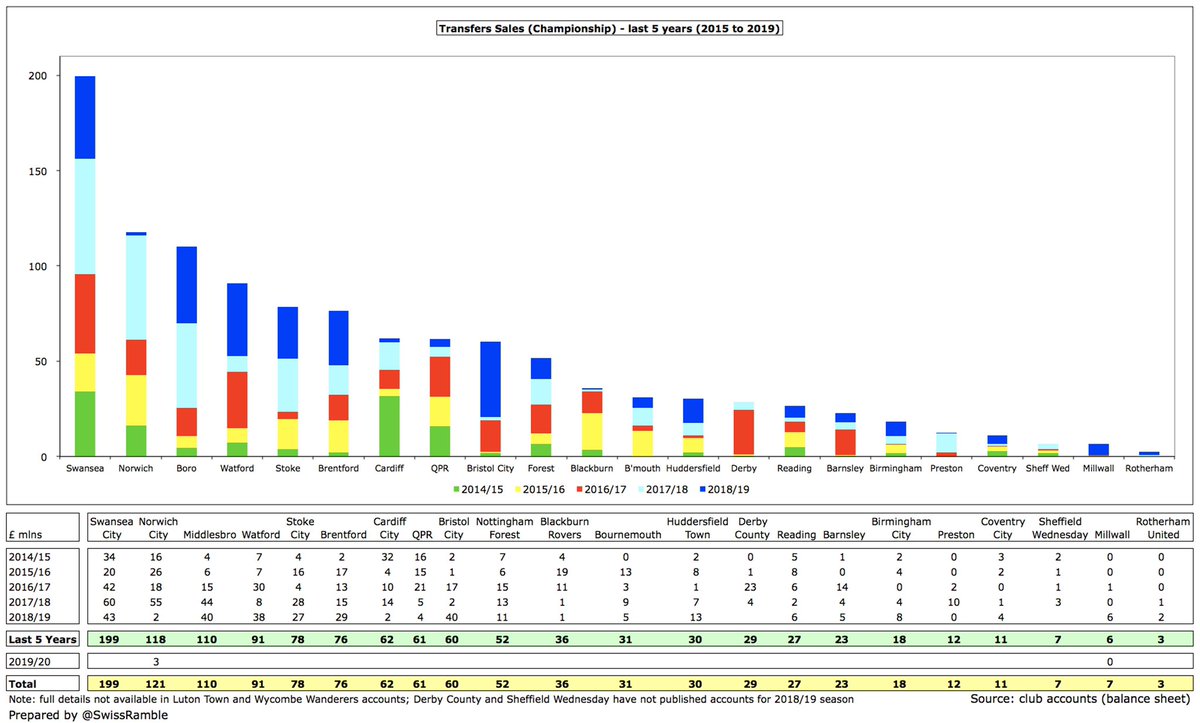
Of the current Championship clubs, #Swans have by far the highest sales in last 5 years with £199m, followed by #NCFC £118m, #Boro £110m, #WatfordFC £91m and #SCFC £78m. The next highest is #BrentfordFC with a noteworthy £76m.
As a technical note, these figures have been taken from the balance sheet in the club accounts. The calculation for player sales here is net book value plus profit on player sales (value equals cost less amortisation for disposals). Includes agents’ fees.
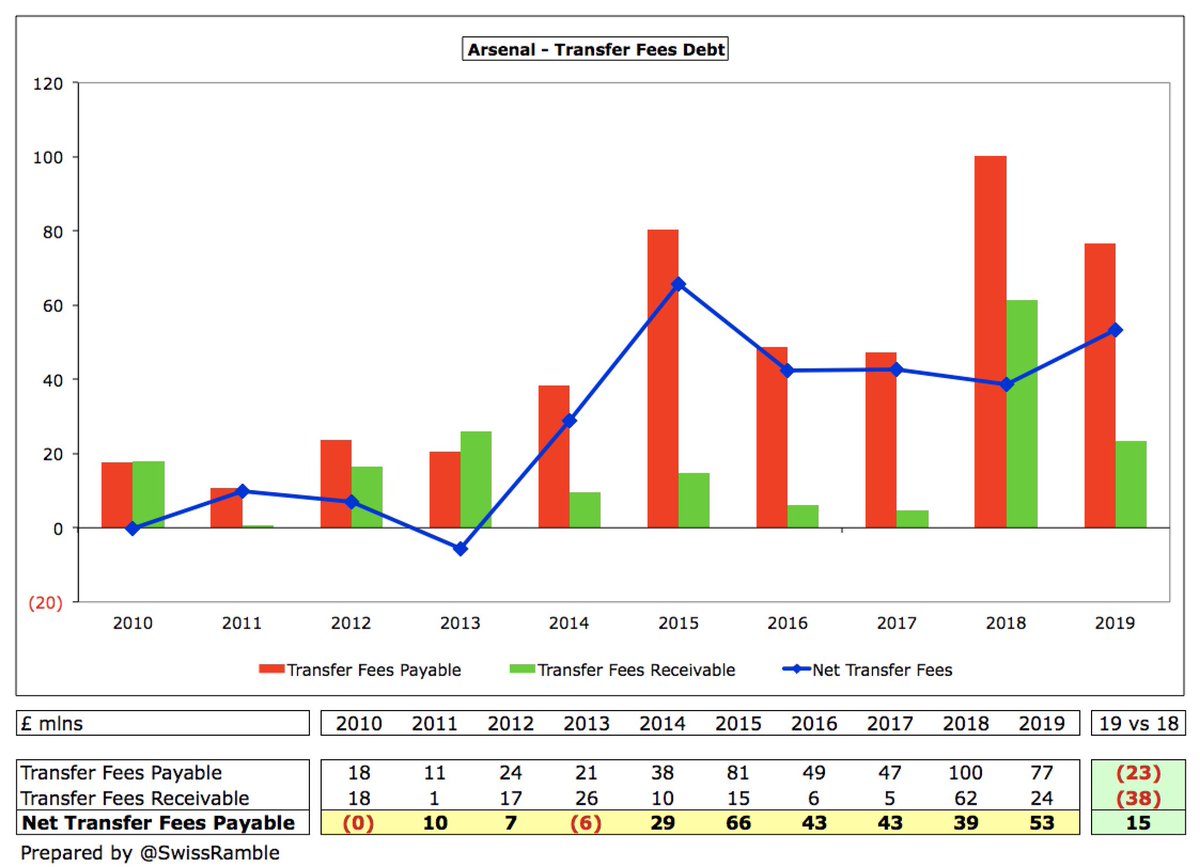
These numbers are different from other transfer figures, e.g. purchases and sales in club’s cash flow statement or those widely reported on the Transfermarkt website. For example, #AFC net spend in 2018/19 is £81m on balance sheet, £62m in cash flow and £65m in Transfermarkt.
Cash flow includes stage payments for prior year transfers. In our #AFC example, the higher figure for purchases reflects the £23m decrease in transfer payables, while the higher figure for sales is due to £38m reduction in transfer receivables.
Transfer spend is likely to fall due to the deflationary impact of COVID on prices, but the 2019/20 figures will still be on the high side, as these cover transfer windows that took place before the pandemic struck, i.e. summer 2019 and January 2020.

 Read on Twitter