virus gonna virus: a tale of 2 biomes.
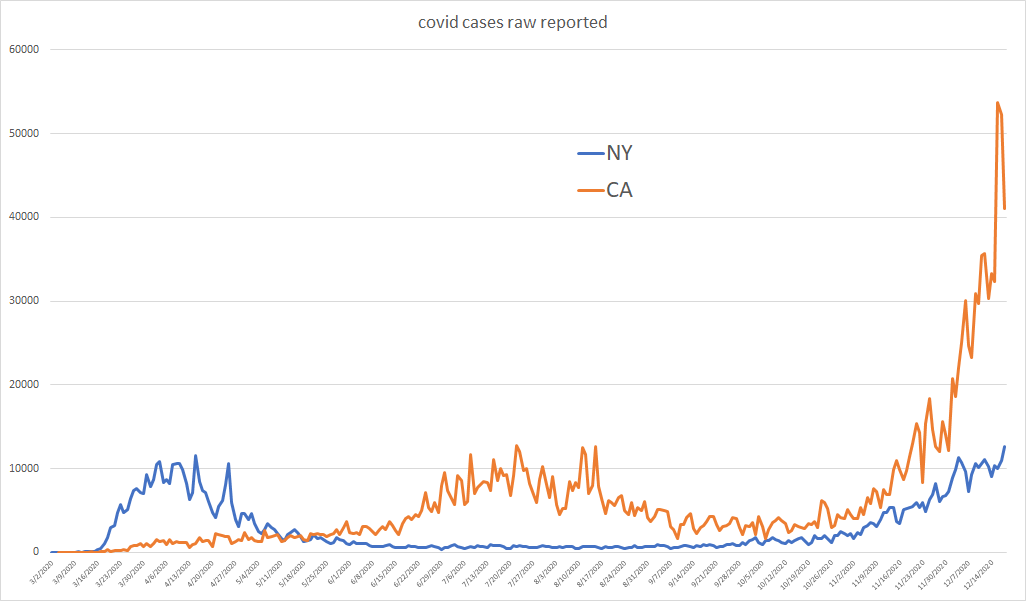
much is being made of cases spiking in NY. it's fueling talk of a "second wave as large as the first."
this does not seem to be supported by the data.
the spike in CA which never had a major first surge, appears to be real.
let's look.
much is being made of cases spiking in NY. it's fueling talk of a "second wave as large as the first."
this does not seem to be supported by the data.
the spike in CA which never had a major first surge, appears to be real.
let's look.
at first pass, that chart looks like a CA explosion and NY hitting levels from april. but it does not account for the rise in testing. this has a profound effect on the shape and magnitude of the 2 curves and drives meaningful divergence.
(all data from covid tracking project)
(all data from covid tracking project)
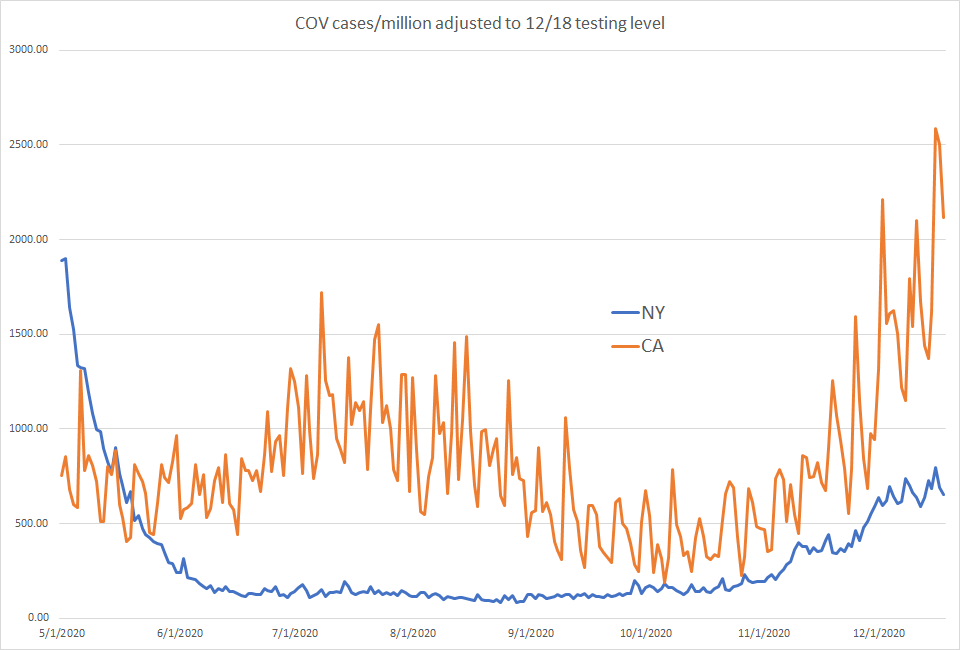
i had to truncate that to may as the testing levels data in CA is too messy to use to normalize the series before then.
but we can run NY all the way back. it makes the trend far more apparent and adds perspective.
current cases are about 12% of prior adjusted peak.
but we can run NY all the way back. it makes the trend far more apparent and adds perspective.
current cases are about 12% of prior adjusted peak.
new york's spike in cases is being predominantly driven by massive testing levels.
we can see this divergence clearly when we add in deaths data.
cases are exceeding prior peak (set to peak deaths date as %)
but deaths are 84% lower.
this is the hallmark of a "casdemic"
we can see this divergence clearly when we add in deaths data.
cases are exceeding prior peak (set to peak deaths date as %)
but deaths are 84% lower.
this is the hallmark of a "casdemic"
california, by contrast, is seeing cases adjusted for testing level break out to new highs.
this makes the spike there, while smaller than reported, appear to be real
as they have not had the big first wave of NY, this is consistent with community immunity not having developed
this makes the spike there, while smaller than reported, appear to be real
as they have not had the big first wave of NY, this is consistent with community immunity not having developed
and this is confirmed in the deaths data which is also breaking out.
while the NY data looks like a case and testdemic, the CA data looks consistent with a seasonal surge arriving
while the NY data looks like a case and testdemic, the CA data looks consistent with a seasonal surge arriving
it can be difficult to clearly see the deaths when scale is swamped by cases, so here is raw CA deaths data
this spike looks real. i suspect it will be confirmed by all cause deaths data when it becomes available
i also suspect it's about to get worse, especially outside socal
this spike looks real. i suspect it will be confirmed by all cause deaths data when it becomes available
i also suspect it's about to get worse, especially outside socal
we can clearly see CA and NY diverging here in terms of magnitude.
deaths follow adjusted cases by a couple weeks, so i would expect to see them keep rising in CA.
deaths follow adjusted cases by a couple weeks, so i would expect to see them keep rising in CA.
this looks to be confirmed by the whole western US biome.
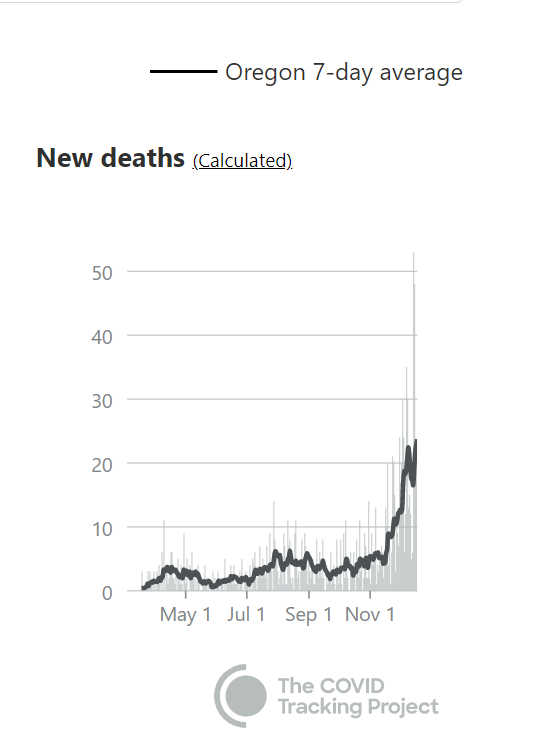
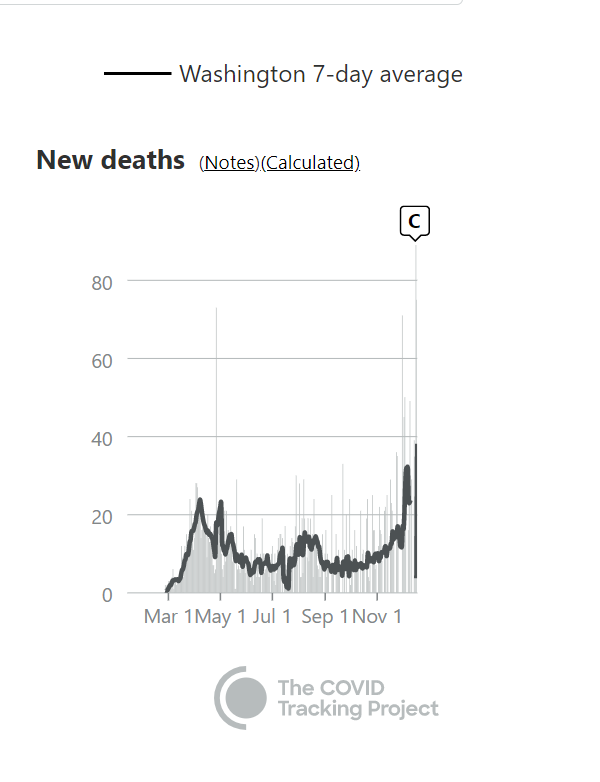
OR and increasingly WA look to be breaking out to new highs on deaths.
cometh the season, cometh the virus. NPI's look like they work when it is not your season.
then, it becomes obvious they do not.
OR and increasingly WA look to be breaking out to new highs on deaths.
cometh the season, cometh the virus. NPI's look like they work when it is not your season.
then, it becomes obvious they do not.
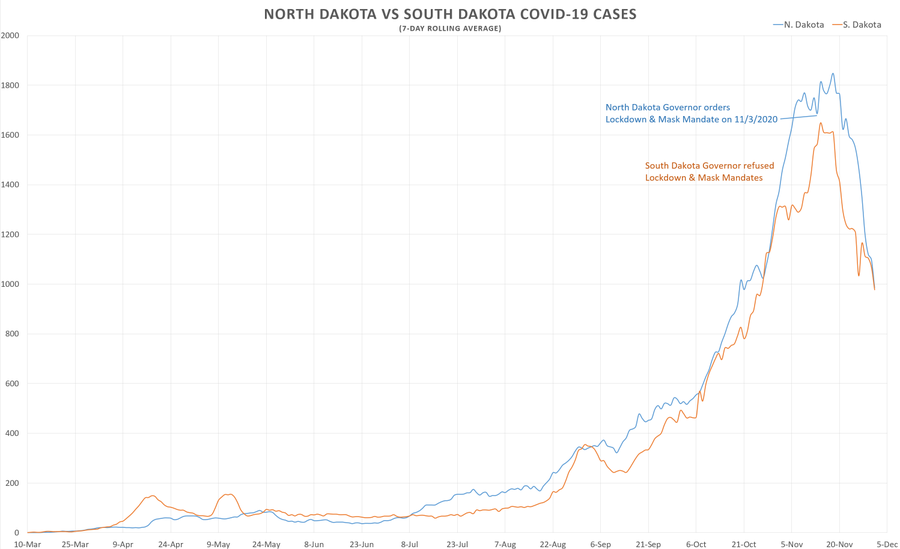
this gets greatly confused and aggravated by the "sun dance" phenomenon where some state (like north dakota) happens to adopt measures right when covid is peaking.
they then assume the dance caused the sunrise.
cuomo is a world class ninja at this
always demand a control group
they then assume the dance caused the sunrise.
cuomo is a world class ninja at this
always demand a control group
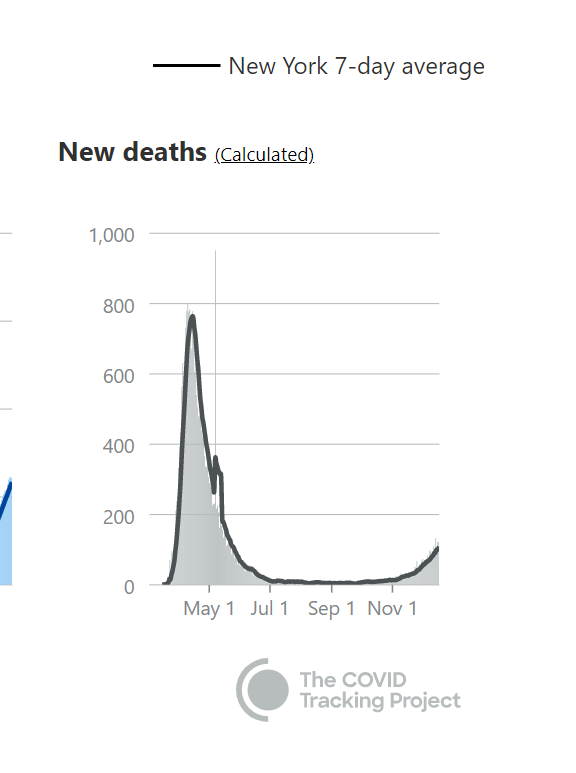
meanwhile, deaths in the northeast remain far lower than in the spring. keep in mind that the next 2-3 weeks are generally the peak of RTI season for US as a whole.
what would be interesting is to break this down by county in NY, NJ, CT etc.
whether the same places are getting second surges or if it's rural now vs urban earlier (as in so many places) it has major implications for herd immunity thresholds.
whether the same places are getting second surges or if it's rural now vs urban earlier (as in so many places) it has major implications for herd immunity thresholds.
that said, i suspect NYC will be a mess. so many people left and came back.
but other counties may be illuminating to track. if anyone has a good way to aggregate and plot this data, let me know.
but other counties may be illuminating to track. if anyone has a good way to aggregate and plot this data, let me know.
and we have this weird "disappearing flu" issue that still does not really seem well explained.
are we miscategorizing flu?
it does seem possible, even likely given the relative testing levels and issues with PCR oversensitivity. https://twitter.com/boriquagato/status/1339552072899977217?s=20
are we miscategorizing flu?
it does seem possible, even likely given the relative testing levels and issues with PCR oversensitivity. https://twitter.com/boriquagato/status/1339552072899977217?s=20
it's also worth remembering that cuomo, murphy etc have done so much damage to their states economies that they desperately need bailouts. they will overstate crisis to get them and have been playing games with data all along.
and they love subsidy. https://twitter.com/boriquagato/status/1333421344994844673?s=20
and they love subsidy. https://twitter.com/boriquagato/status/1333421344994844673?s=20
but, all in all, we just keep seeing seasonality play out and crush whatever delusions of NPI efficacy happen to be pervasive in places not yet hit.
claims it worked never seem to stand up to data normalization and control groups. https://twitter.com/boriquagato/status/1336294261193641985?s=20
claims it worked never seem to stand up to data normalization and control groups. https://twitter.com/boriquagato/status/1336294261193641985?s=20
it shows up clearly in the comparison data. https://twitter.com/boriquagato/status/1336043804311363586?s=20
my prediction is this: covid still has the west coast yet to go. it will spike there because it has not done so to great extent yet.
CA will see a surge. it will be focused in norcal. socal got a round of exposure in the summer along with TX, AZ, etc.
CA will see a surge. it will be focused in norcal. socal got a round of exposure in the summer along with TX, AZ, etc.
the northeast will report covid and grab CARES money and squall for bailouts.
the true test of whether they hit HIT will be whether deaths follow suit and to confirm those deaths are real covid deaths, are confirmed by a rise in excess mortality
the true test of whether they hit HIT will be whether deaths follow suit and to confirm those deaths are real covid deaths, are confirmed by a rise in excess mortality
if the NE does not show excess mortality, then it will be indicative of herd immunity.
it's going to be a while for that data. (and be careful using the CDC graphing tool. it uses a bizarrely low baseline and overstates EM by quite a lot)
it's going to be a while for that data. (and be careful using the CDC graphing tool. it uses a bizarrely low baseline and overstates EM by quite a lot)

 Read on Twitter