How much greater are deaths in 2020 than recent years? We don't know yet, because the year isn't over, but so far the best estimate is about 13%. How does that compare with prior 1-year increases? See this chart. It's A LOT more death
This is just the crude number of deaths. Over long periods of time, you want to adjust for population size, as well as the age structure of the population (known as age-adjusted mortality). But year-to-year, those things don't change much, so I think this is a useful measure
I've cobbled the data together from various sources, such as the Historical Statistics of the US, the CDC, and the Human Mortality Database. I'm pretty sure they are accurate, but correct me if you know of better data!
The data starts in 1933, the first year all 48 states were in the national death registry
I didn't make any adjustment for 1959 when Alaska and Hawaii were added to the data, but that doesn't really matter (1959 was +0.9%)
I didn't make any adjustment for 1959 when Alaska and Hawaii were added to the data, but that doesn't really matter (1959 was +0.9%)
Here are the years with the largest one-year increase (again, 2020 is estimated based on first 45 weeks)
2020: 13.2%
1936: 6.2%
1943: 5.4%
1957: 4.4%
1993: 4.3%
1968: 4.3%
1934: 4.1%
1980: 4.0%
1947: 3.6%
2015: 3.3%
1962: 3.2%
1963: 3.2%
1955: 3.2%
1960: 3.1%
2020: 13.2%
1936: 6.2%
1943: 5.4%
1957: 4.4%
1993: 4.3%
1968: 4.3%
1934: 4.1%
1980: 4.0%
1947: 3.6%
2015: 3.3%
1962: 3.2%
1963: 3.2%
1955: 3.2%
1960: 3.1%
So prior to 2020, the worst years were in the Depression, WW2, and the 1957 flu pandemic. But 2020 is likely going to be at least double all these years. I wouldn't be surprised if we got to 15%, close to triple the annual increase of some of the worst years in the 20th century
All year long, people have been asking me "OK, we see these daily death numbers, but how many people die in a *normal* year?"
It was a good question, and it still is. It was hard to answer mid-year. But as we approach the end of 2020, it's becoming quite clear this is a BAD year
It was a good question, and it still is. It was hard to answer mid-year. But as we approach the end of 2020, it's becoming quite clear this is a BAD year
Oh, and keep in mind that the deaths from COVID didn't really take off until the end of March. And they will likely continue through March 2021 or later, as vaccines will still be rolling out. So the April 2020-March 2021 will be the real "pandemic year" to compare
Now. Does a year when the number of deaths increases by more than double any past increase justify all the government interventions? Does it mean we should have done *more*? I obviously have my own opinions, which normal followers know
But, one general observation: many of the folks most skeptical of all the government interventions have also been the most eager to downplay the extent of death. Some have even insisted, based on bad understanding of the data, that 2020 would be a low death year!
I don't quite know how to interpret this. Would they have changed their mind if they knew that deaths would be 13-15% higher? I don't know. Probably not. But I do wonder if the "it's a normal year" crowd will admit they were wrong, and explain why these numbers don't matter now
Have a great weekend everyone!
OK, so I am apparently being accused of cherry picking the data or something to make 2020 look bad. Regular followers know that's not what I do. Starting in 1934 is not unusual. As I explained in the thread, that's when the national death registry contains all states
However, we can get crude death rates back to 1900, but for a select number of states: 10 states in 1900, representing about 1/4 of the population. This gradually increases until all states are included in 1933
All explained in HSUS: https://www2.census.gov/library/publications/1975/compendia/hist_stats_colonial-1970/hist_stats_colonial-1970p1-chB.pdf
All explained in HSUS: https://www2.census.gov/library/publications/1975/compendia/hist_stats_colonial-1970/hist_stats_colonial-1970p1-chB.pdf
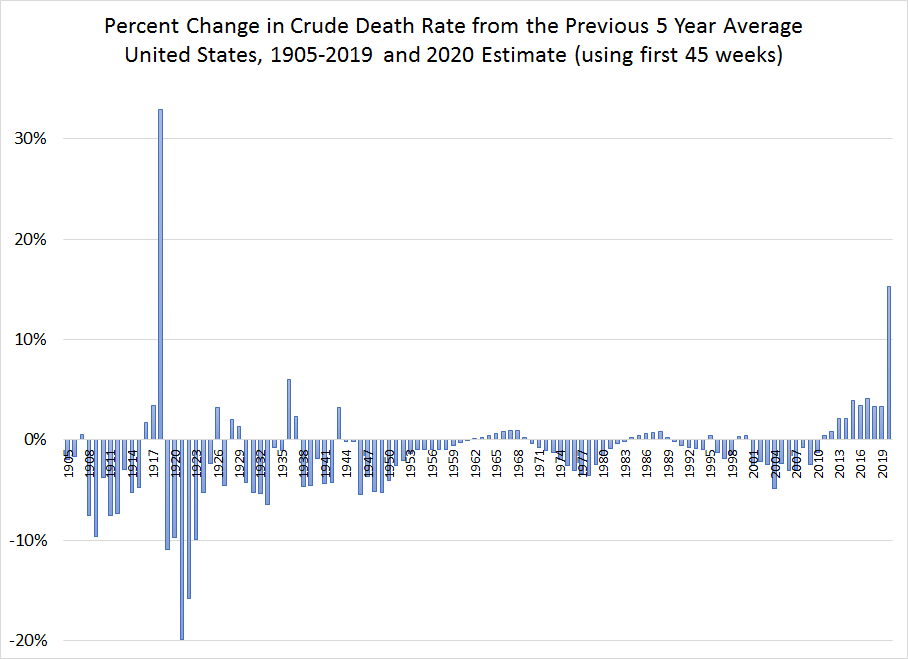
The other complaint: is a one-year change the best way to to go? Maybe not. I can compare a year's death rate to the past 5 year average too. And it looks something like this:
2020 still stands out as an anomaly: 15.3% above the past 5 years. The only year that beats it (by a lot!) is 1918, when you have both a major flu pandemic and a world war: 32.9% above the past 5 years
And now, have a great weekend!
And now, have a great weekend!

 Read on Twitter


