DOMINION
An unbiased by-county analysis of over 3000 U.S. counties shows Joe Biden received 5.6 % more votes in counties using Dominion Voting Systems. "If a network system of computers was used to fraudulently affect vote counts...the results would look exactly like this."

An unbiased by-county analysis of over 3000 U.S. counties shows Joe Biden received 5.6 % more votes in counties using Dominion Voting Systems. "If a network system of computers was used to fraudulently affect vote counts...the results would look exactly like this."
2/ This Dominion advantage was observed regardless of the county's majority political party affiliation nor urban, suburban, or rural-area demographics. Biden over-performed our estimates in “democratic strongholds” – by the same amount he over-performed in “Trump” counties.
3/ The analysis is not directed at a single or handful of counties. Instead, this information uses data from all counties in the United States to see if there is a discernable widespread pattern involving type of voting machine and vote totals.
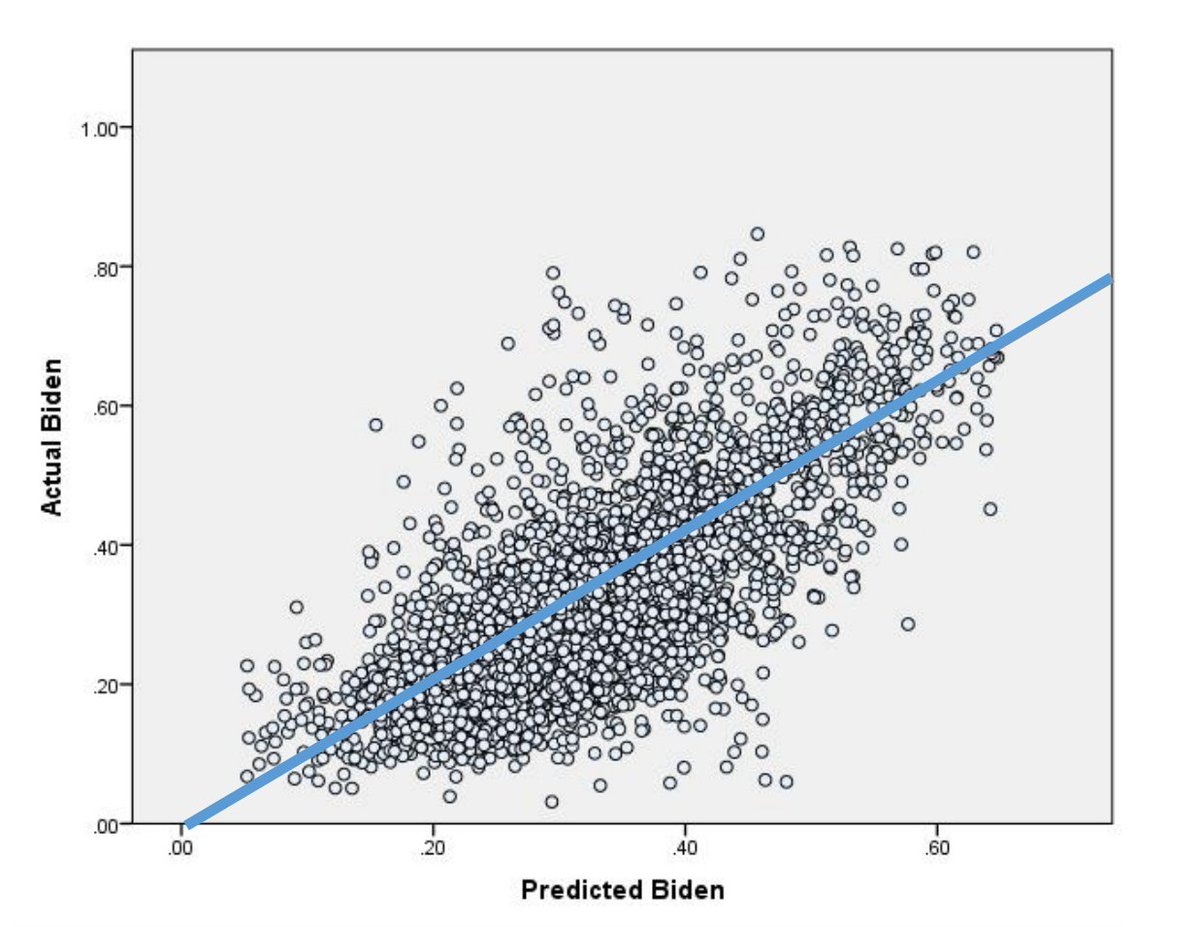
4/ In the first graph, we see Biden’s actual 2020 election results. The blue line is our center “prediction” line. Half the counties should be above the blue line & half below. This is confirmed true with Biden over-performing in 45% of counties & underperforming in 55%.
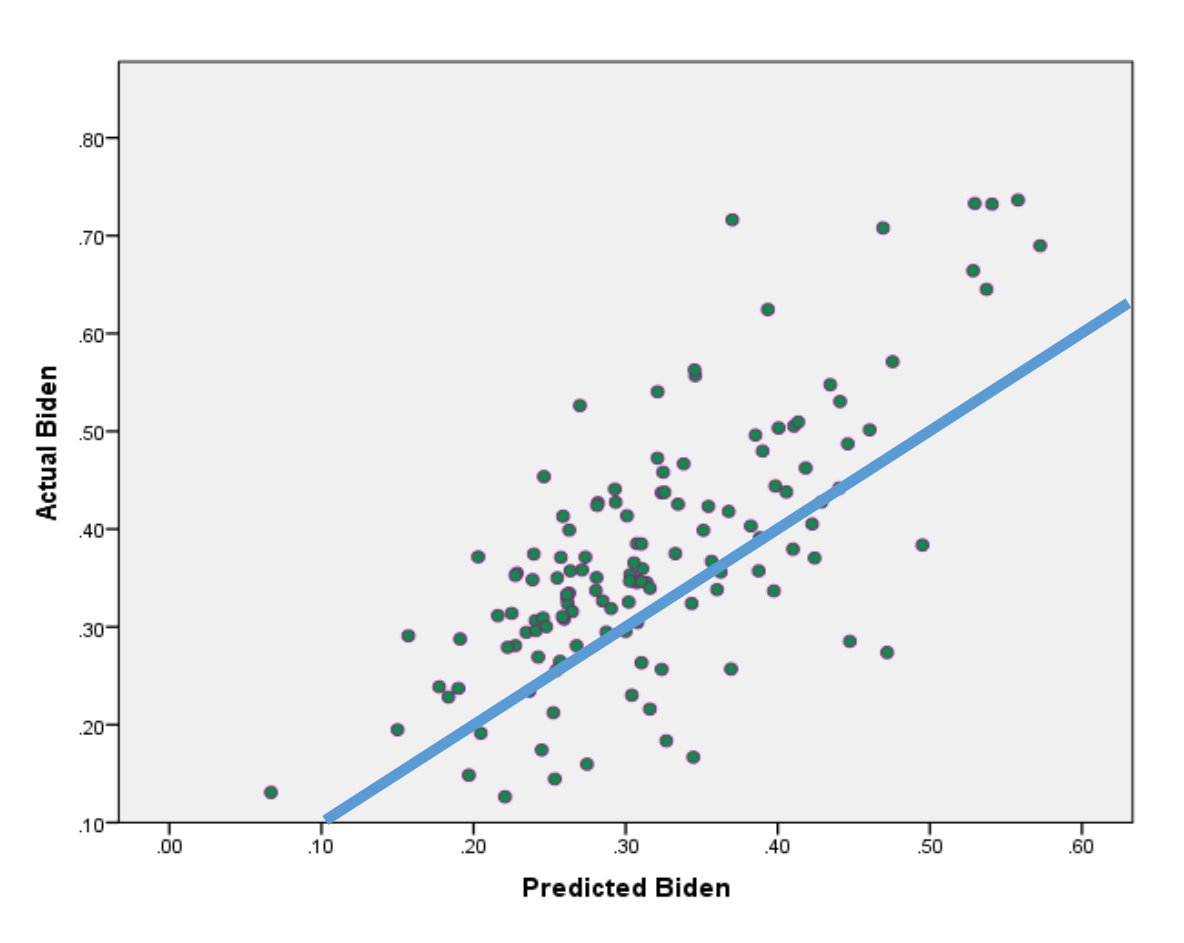
5/ We obtained data from the U.S. Election Assistance Commission showing the voting machines used by each county. Compare this graph with the same data, except this time limited to counties using Dominion. This time the majority of counties (78%) are ABOVE the prediction line.
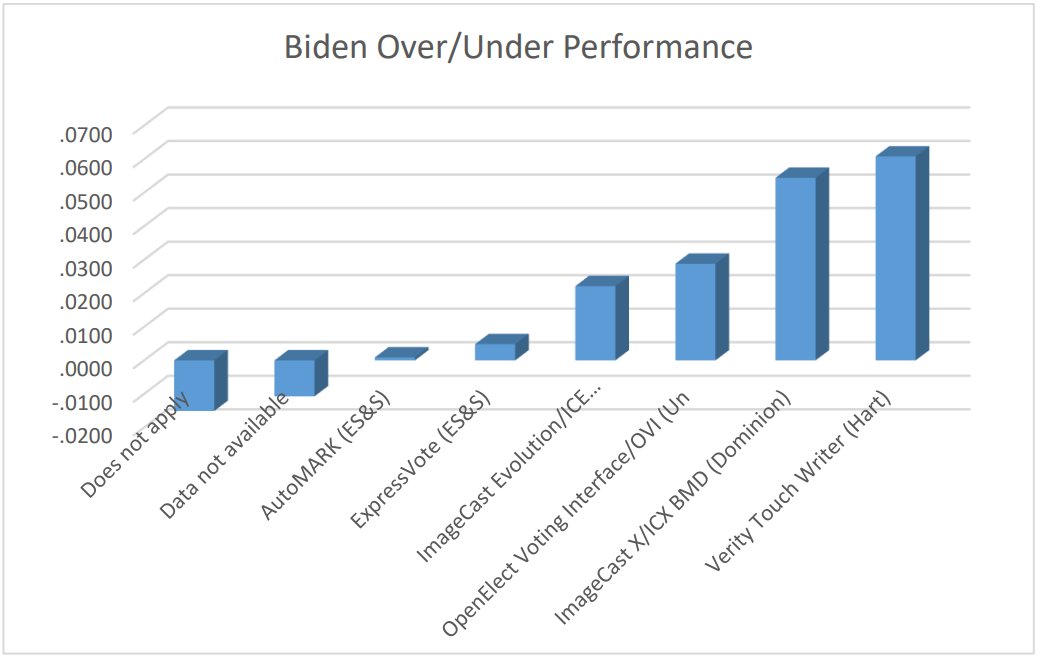
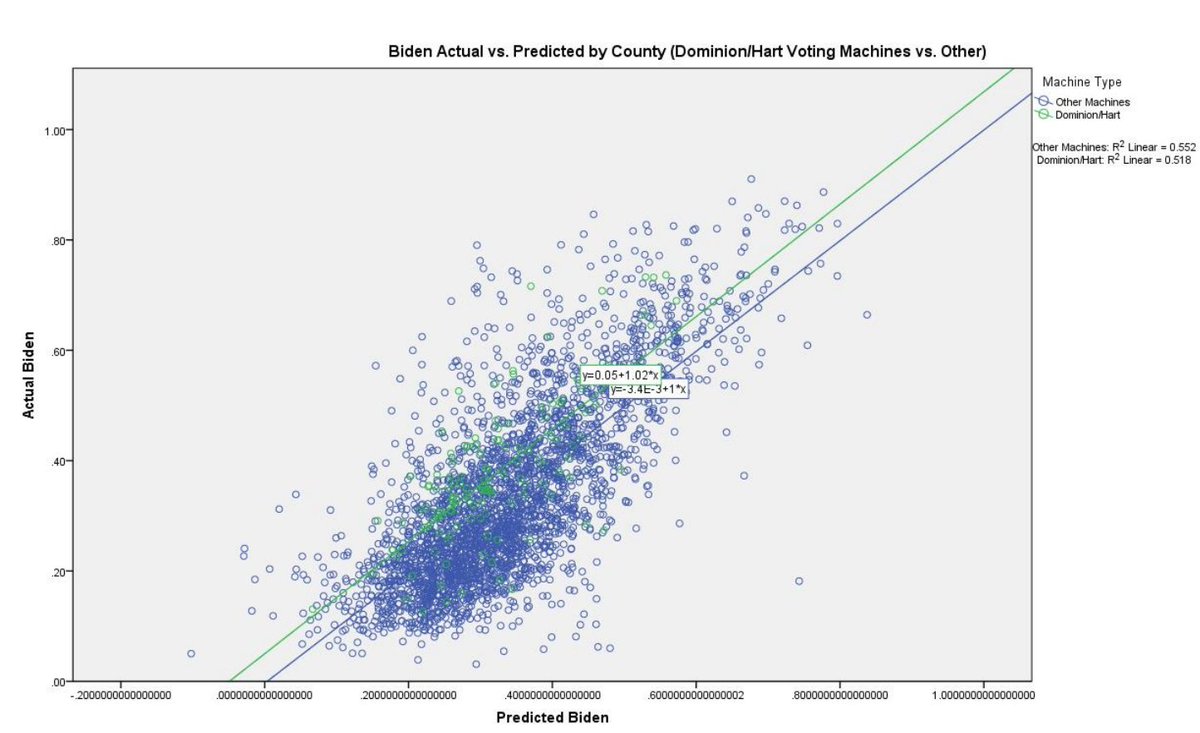
6/ The county data filtered by voting machines shows us that candidate Biden over performed by approximately 5% on Dominion machines AND also by approximately 6% on Hart machines.
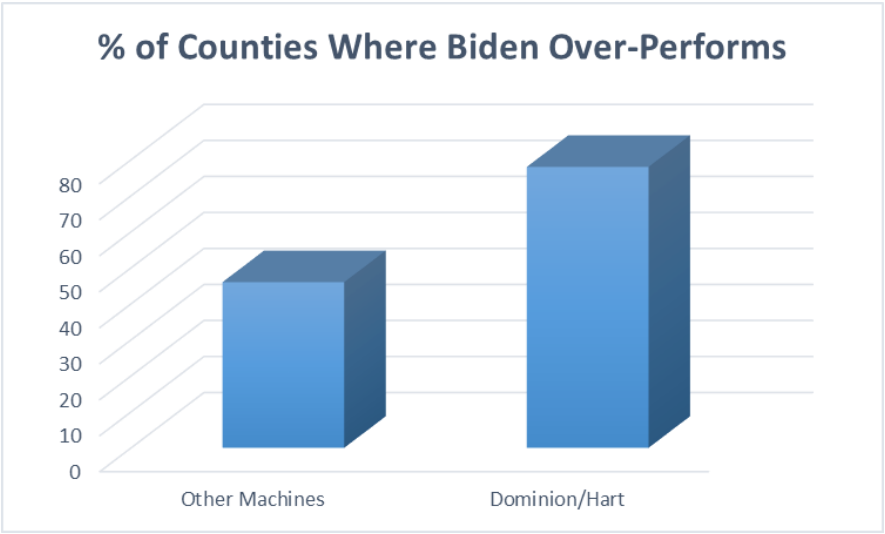
7/ In the Dominion/Hart machine counties, Biden performs above expectations 78% of the time. This is highly indicative (and 99.9% statistically significant) that result manipulation could be occurring with Dominion & Hart machines.
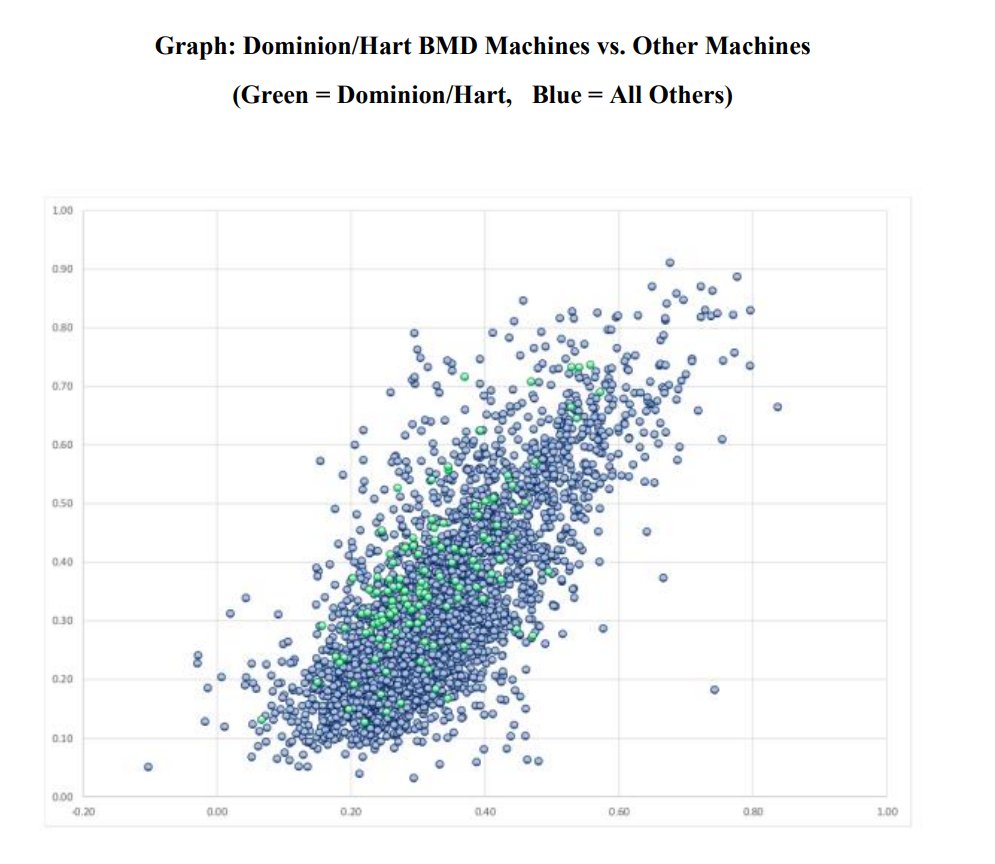
8/ In this graph, we see green dots represent votes from counties using Dominion/Hart machines. The green dots should overlay the blue dots in a similar, mixed up/random fashion. We do not see this. Instead, we see the green dots centered higher than the center of the blue dots.
9/ To aid in this graphical analysis we added center lines for the Dominion/Hart counties and the “other machine” counties. The green centerline stays above the blue centerline – clearly indicating Biden continuously "outperforming" in Dominion/Hart counties.
10/ The increases in votes occurred in hundreds of Dominion/Hart counties across the U.S. Again, it is important to understand, Biden "over-performed" in "democratic strongholds" – by the same amount he over-performed in “Trump” counties as long as these machines were used.
11/ CONCLUSION
This indicates that some or all of the Dominion/Hart machines may have been programmed or manipulated to systematically add five plus percentage points to Biden’s actual vote count. Again, the statistical significance level of these results is above 99.9%.

This indicates that some or all of the Dominion/Hart machines may have been programmed or manipulated to systematically add five plus percentage points to Biden’s actual vote count. Again, the statistical significance level of these results is above 99.9%.
12/ VIDEO: [Part One]
13/ VIDEO: [Part Two]
14/ VIDEO: [Part Three]
15/ VIDEO: [Part Four]
16/ VIDEO: [Part Five]
17/ VIDEO: [Part Six]
18/ FULL VIDEO: https://rumble.com/vbz2ld-2020-election-shows-joe-biden-over-performs-in-72-of-counties-using-dominio.html
19/ FULL SUMMARY:
https://gofile.io/d/WtDVhe
https://gofile.io/d/WtDVhe

 Read on Twitter