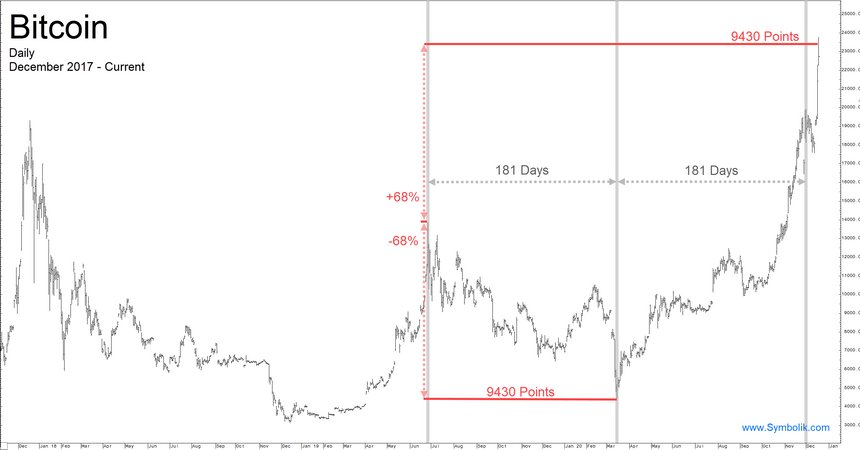
Tom Demark says his indicator was flashing a warning signal for $BTC “The prior instances in which this long term model has spoken include the precise December 18, 2017 high, the precise low day December 14, 2018, and then the precise June 26, 2019 high day,” DeMark wrote.
$BTC
$BTC
He also said " $BTC 's decline from its June 26, 2019 high to a bottom March 16 was 9430 points", and adds that “if one were to add 9430 points to the June 26, 2019 high it projects upside to 23,288 which is the zone in which the current market is trading.”
Very interesting.
Very interesting.
Personally think that a lot of warning signs are flashing right now and this is about the most over extended $BTC has been in its history besides the 20k top, but I would put this second IMO. Funding is extreme, futures markets volume is outweighing spot by a big margin.
This isn't to say we will see an immediate correction, but it is interesting that his indicator was so accurate in the past. But I still think nothing can pin point tops and bottoms perfectly, but this is as close as you get for $BTC. I give it a week range for it to play out.

 Read on Twitter


