$TSLAQ This post has nothing to impart about the accounting of $TSLA. So, if you are looking for witty repartee focusing on $TSLA, stop reading. In addition, if statistics are not in your wheelhouse, stop reading. (1/15)
Every week or so depending on my motivation and available time, I regress the performance of the equity markets based on fundamental and a few technical indicators on a weekly & monthly term. I use the results to search for underpriced equities. (2/15)
Why am I posting this now? Only to describe the ultimate departure of logic & reason within the market over the last 90 days. I know logic left the market long ago, but this is idiotic. (3/15)
THIS has become an unholy function of FOMO, Federal Reserve, new market participants, and whatever else could be included in the absolution of risk tolerance and aggressive trading. So, just follow this tour of joy of the equity markets. (4/15)
My regression is an OLS cross-sectional with control variables that try to capture the most variance of the individual equities returns over a weekly & monthly period. It starts with a big pile of multicollinearity, heteroskedasticity, and homoscedasticity. (5/15)
Working through a stepwise and constantly modifying the model by using VIF, I reduce it into a form that is the least oversubscribed (VIF & MSE) as well that has the fewest issues with OLS diagnostics. The net of these models has an R2: .13-weekly, .24-monthly, .20-qtr (6/15)
To start, the only technical indicators that do not have significant endogeneity with the performance of the individual stock are RSI & GAP. I could throw in a bunch of dummy variables by chart formation. But with an N>4000, I just Homer Simpson it. (7/15)
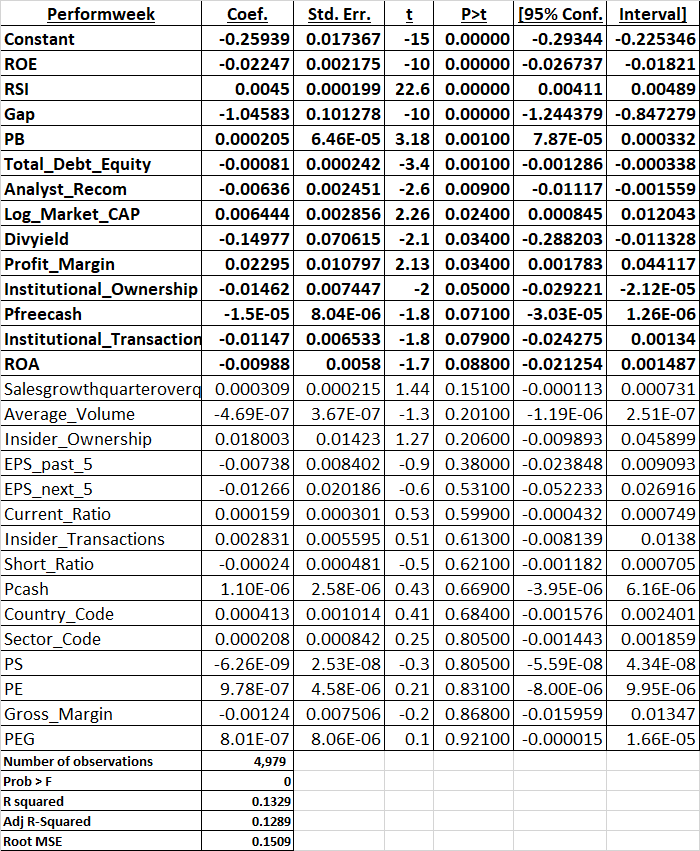
So let’s have some fun. Weekly: Bold are factors that have marginal, moderate or statistical significance (range of .10 to .0000.) It’s not the factors that have significance. It’s the signs that are unholy. (8/15)
Dependent variable is the performance of over 4,979 equities traded in the US for the week. I am trying to find what characteristics are significant in the change in stock price. Look at the factors with a negative relationship to a week with a positive return. (9/15)
ROE, price to book, dividend yield, price to free cash flow, ROA were negatively correlated to the stock performance last week. For that matter, so was market cap. If you were a large, profitable company, paying a dividend, with positive free cash flow, BAD. (10/15)
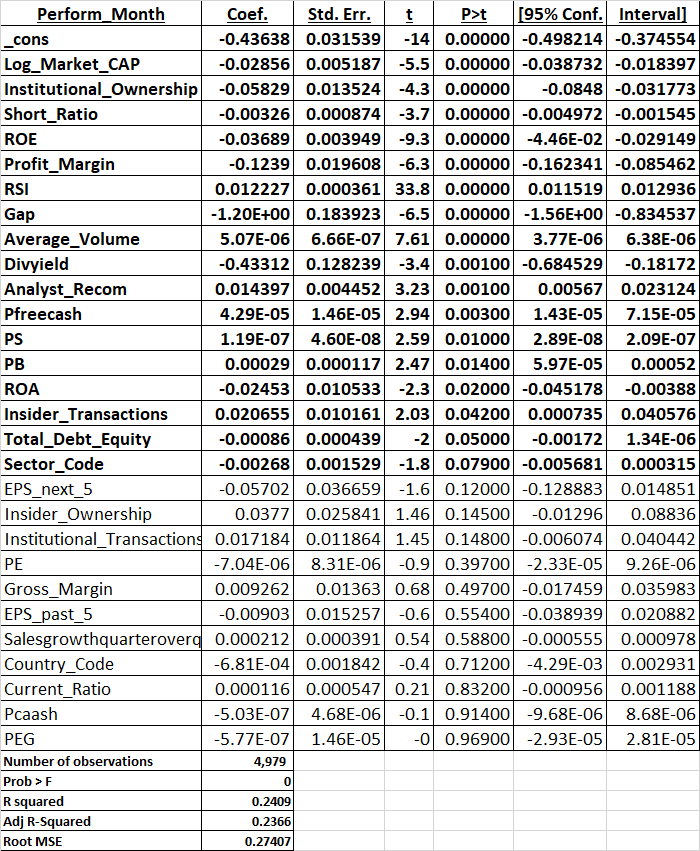
Ok, five trading days is an anomaly. So let’s try a month. Dependent variable is individual stock performance using the same data set for a month. Two factors become logical, price to free cash flow & price to sales (positive.) (11/15)
I interpret this as the bias of a metric sh!t ton of unicorns (AirBnB, Doordash) & SPACS coming to market. Further analysis would suggest that momentum investing is now dancing on Ben Graham’s grave. (12/15)
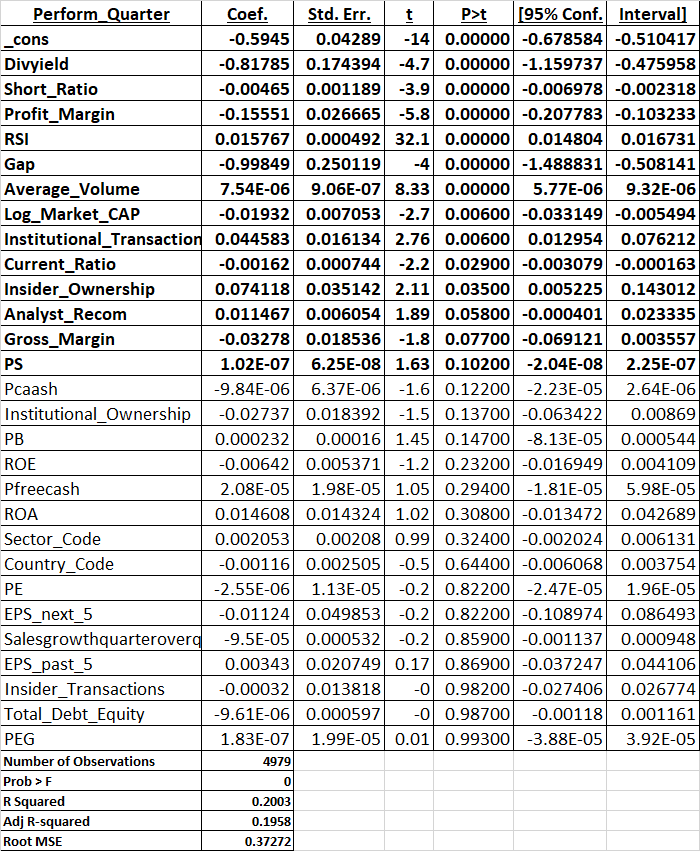
But, and this is the most disconcerting, it’s the first time virtually all fundamental performance metrics are negatively correlated to performance over a 30 day period. So I ran a quarterly. (13/15)
AND IT HAS THE SIMILIAR FUNCTIONS. Free cash flow is not even significant but price to sales remains. And all those things measuring fundamentals? All negatively correlated to the market. (14/15)
To recap, the market is telling traders to find: a smaller cap money losing shitco that an analyst says has a nice story but does not have the ability to reward a shareholder with a dividend but is increasing sales by losing money. (15/15)

 Read on Twitter


