This week @NatRecordsScot released new figures showing the extraordinary rise in drug-related deaths in Scotland has continued, with numbers doubling since 2013.
As a non-expert, here's a few things I found interesting in this data:

As a non-expert, here's a few things I found interesting in this data:

1/ This isn't due to a dramatic rise in deliberate overdoses. The increasing numbers are entirely being driven by accidental poisoning.
2/ Although the absolute number of drug-related deaths is higher in men, the relative increase in deaths in the past 15 years has been much bigger among women. Indeed, almost all of the increase in numbers between 2018 and 2019 is down to a rise in female deaths.
3/ If we compare drug-related death rates between Health Board areas, Glasgow has consistently come out worst.
Although interestingly, the NRS report presents older data on prevalence of drug use which suggests the death rate *per problem drug user* is *lower* than elsewhere.
Although interestingly, the NRS report presents older data on prevalence of drug use which suggests the death rate *per problem drug user* is *lower* than elsewhere.
4/ The data also reports on the involvement of different drug types (the overwhelming majority of deaths (94%) involve multiple drugs).
Increases in most drugs, but the rise in deaths involving so-called 'street' benzodiazepine (benzos) is absolutely terrifying.
Increases in most drugs, but the rise in deaths involving so-called 'street' benzodiazepine (benzos) is absolutely terrifying.
5/If you look at these figures as the proportion of all deaths which involve each drug, this becomes even more striking. The % of deaths involving opiates/opioids has barely changed, while the last 5 years have seen street benzos increase from 8% of deaths in 2015 to 64% in 2019
6/ Alongside this dramatic shift in the type of drugs that are implicated in drug-related deaths, there has been a massive shift in the age groups that are dying.
Drug related deaths in 35-54 year olds have gone through the roof in recent years.
Drug related deaths in 35-54 year olds have gone through the roof in recent years.
7/ If you look at the age profile of deaths by drug involvement, you can see these age groups are the ones whose deaths are most likely to involve street benzos.
The rise in deaths from cocaine appears to be driven by younger age groups, however.
The rise in deaths from cocaine appears to be driven by younger age groups, however.
8/ On the subject of which - if you look at the profile of drugs involved in deaths across Health Board areas, Grampian (Aberdeen and surrounds) stands out for several reasons:
The highest % of deaths involving cocaine and prescribable benzos, but the lowest from street benzos.
The highest % of deaths involving cocaine and prescribable benzos, but the lowest from street benzos.
10/ Of the 24 Local Authorities in the UK with the highest rates of drug misuse deaths, only one (Blackpool) is not in Scotland.
11/ So all in all this is pretty grim.
But as someone who primarily works in alcohol and has done a lot of work in Scotland, I immediately wonder how these numbers compare to alcohol deaths.
But as someone who primarily works in alcohol and has done a lot of work in Scotland, I immediately wonder how these numbers compare to alcohol deaths.
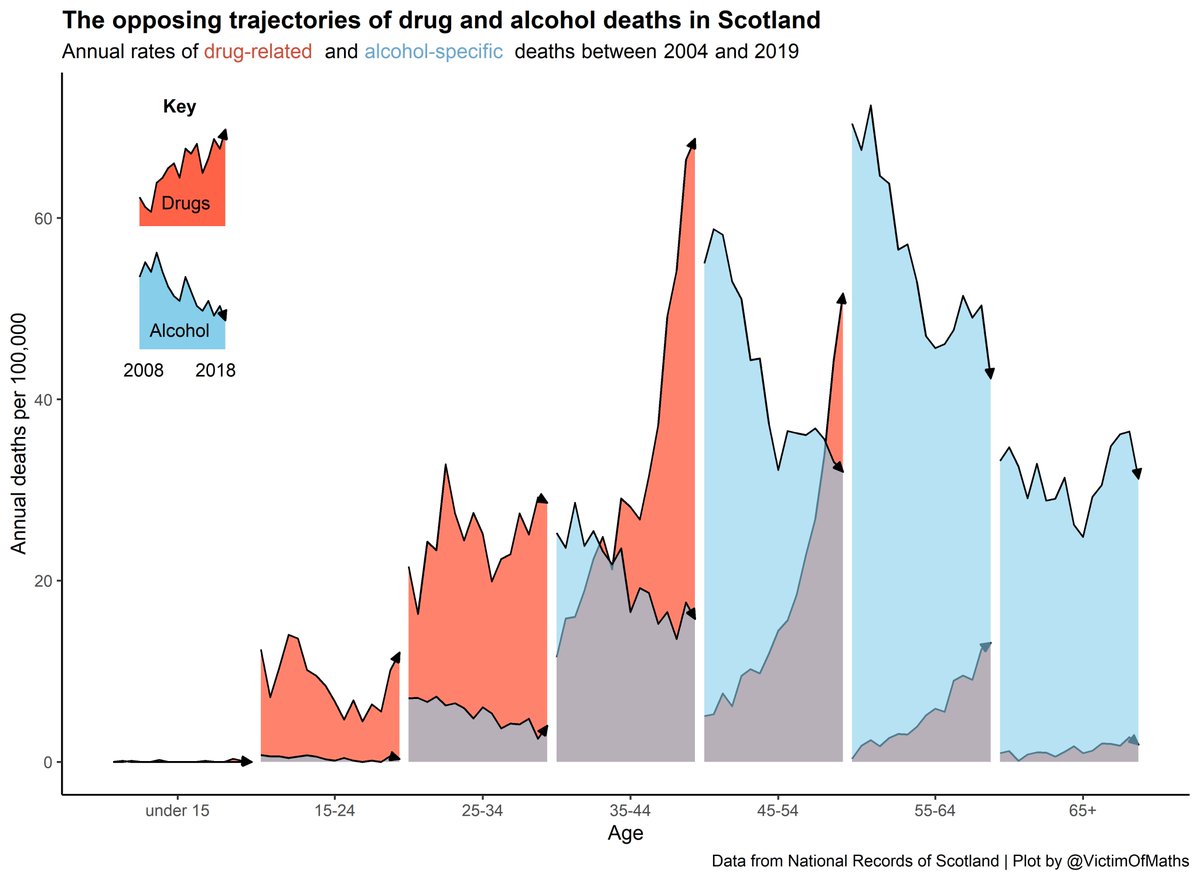
12/ If we compare the rates of drug-related and alcohol-specific deaths, the difference is striking. While drug-related deaths have been rising, deaths from alcohol-specific causes have been falling, nearly, but not quite, as dramatically.
13/ So does this mean that Scotland has resolved its problem with alcohol?
Well, no. Not yet.
For one thing, alcohol-specific deaths represent only around a third of all deaths caused by alcohol.
Well, no. Not yet.
For one thing, alcohol-specific deaths represent only around a third of all deaths caused by alcohol.
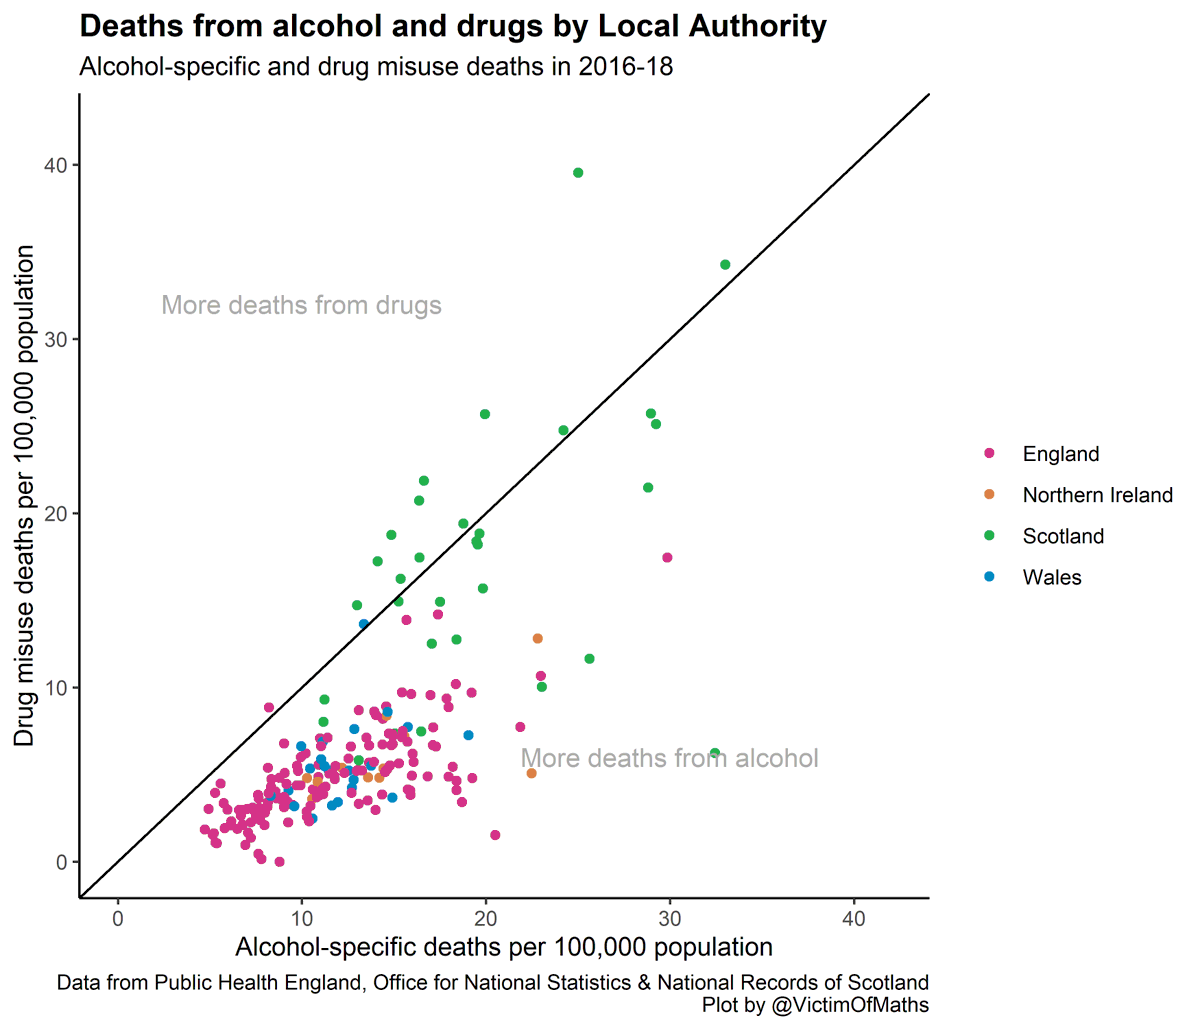
14/ But also, while Scottish Local Authorities have higher rates of drug-related deaths than elsewhere in the UK, they also tend to have higher rates of alcohol-specific deaths.
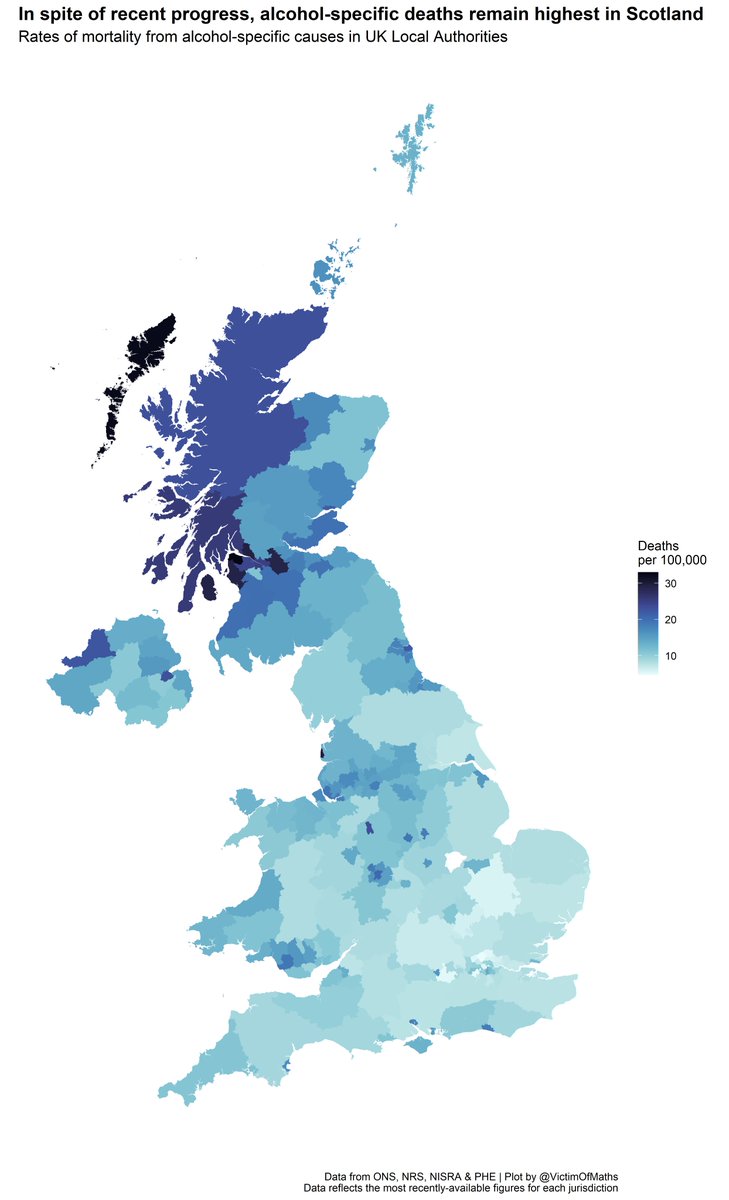
15/ If we plot this on a map, you can really see that this progress in reducing alcohol-specific deaths in Scotland has yet to bring large parts of the country into line with the rest of the UK.
16/ 'Bivariate' maps like this let us compare death rates across both drug-related and alcohol-specific causes.
And it isn't pretty for Scotland. Or the NE of England for that matter.
And it isn't pretty for Scotland. Or the NE of England for that matter.
All R code for these plots is here: https://github.com/VictimOfMaths/DeathsOfDespair/blob/master/DRDASD2020.R

 Read on Twitter


