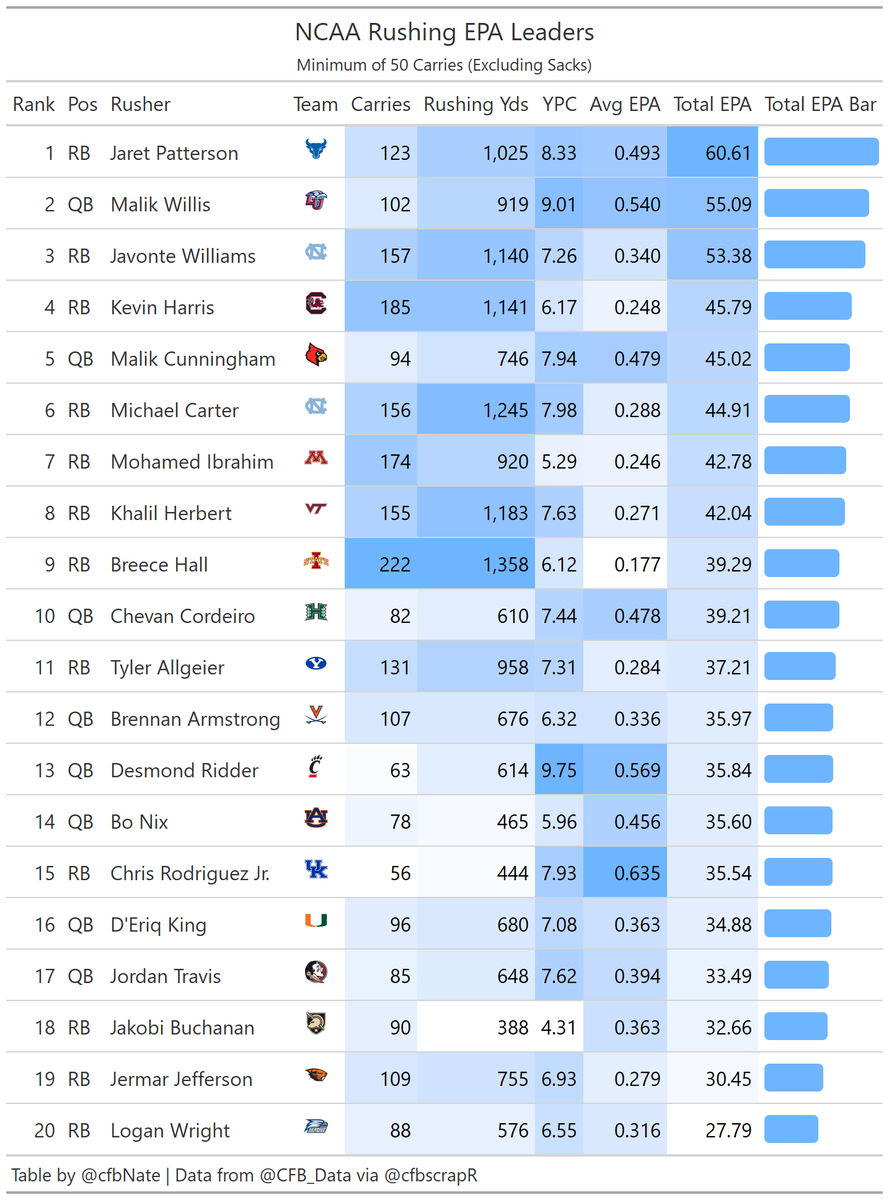
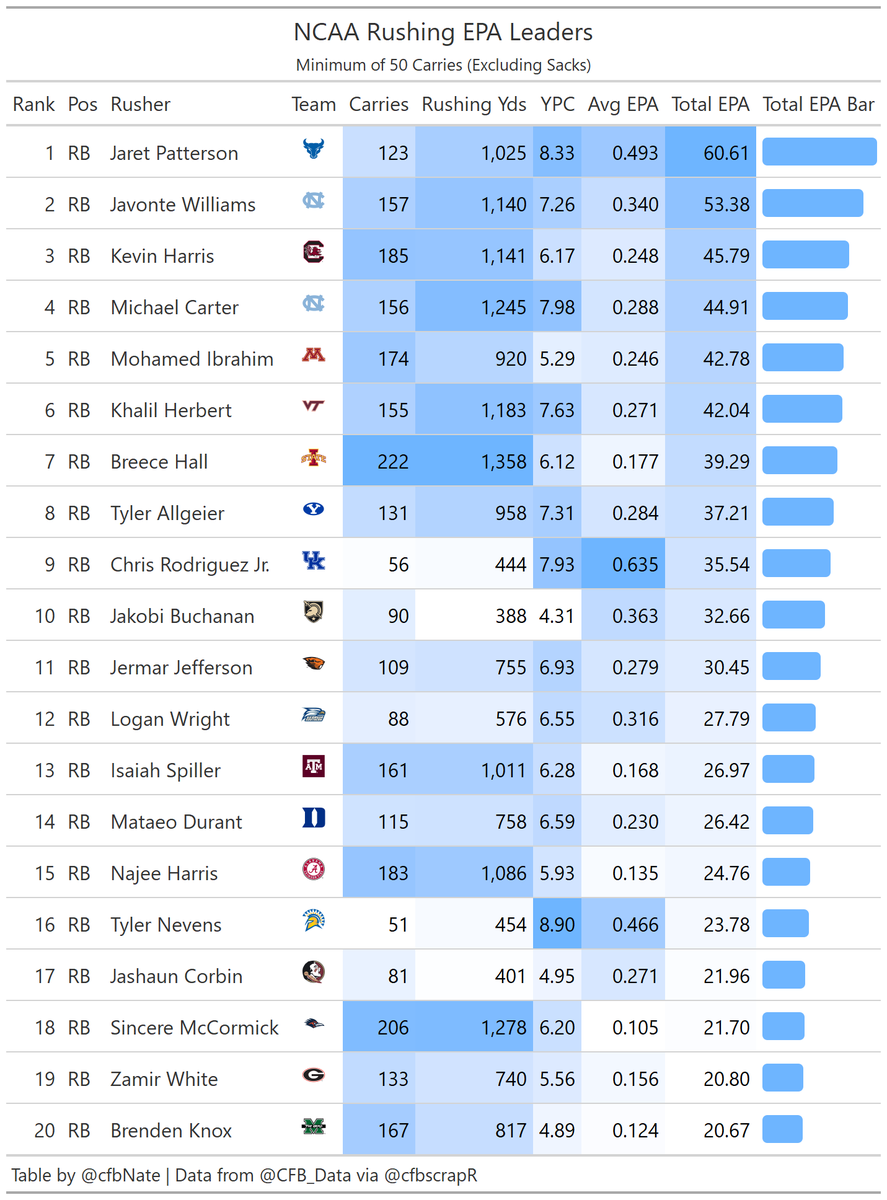
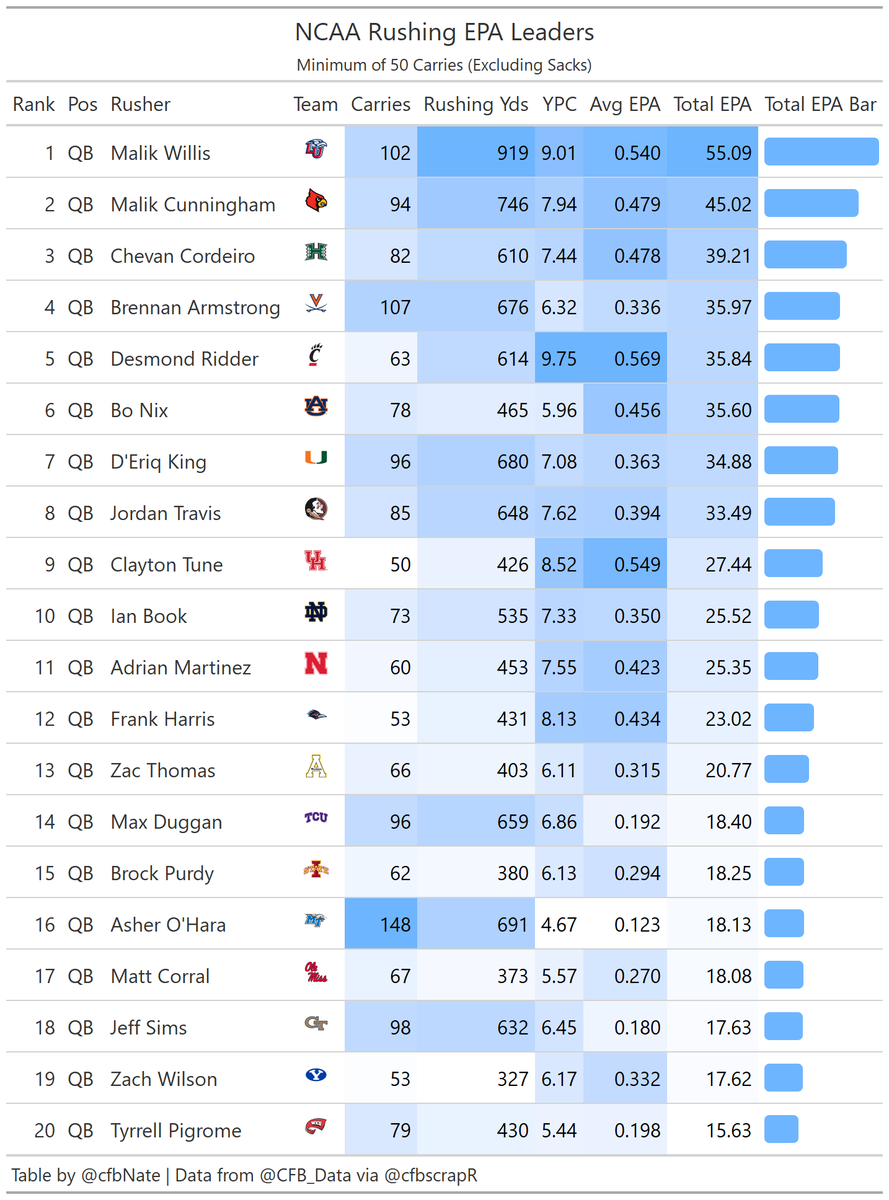
NCAA FBS Rushing EPA Leaders through Week 15.
Players are ordered by Total EPA here because that seems like the best way to measure the total impact a player has had on the season.
Min Carry threshold is intentionally low because of 2020 shenanigans.
Players are ordered by Total EPA here because that seems like the best way to measure the total impact a player has had on the season.
Min Carry threshold is intentionally low because of 2020 shenanigans.
It's easier for QBs to average a higher EPA per carry since they have the threat of the pass to occupy the defense on so many of their carries. It's maybe unfair to include them in the same table so here they are broken out.
Shout out to @thomas_mock (aka the master of tables ) for his examples on how to spruce up gt tables with cell shading, images, and barplots. https://themockup.blog/
Yardage and carry totals might be ever so slightly off from the official numbers because only plays with valid EPA are considered (no OT or broken ESPN play-by-play data) but let me know if anything is egregiously wrong.

 Read on Twitter


