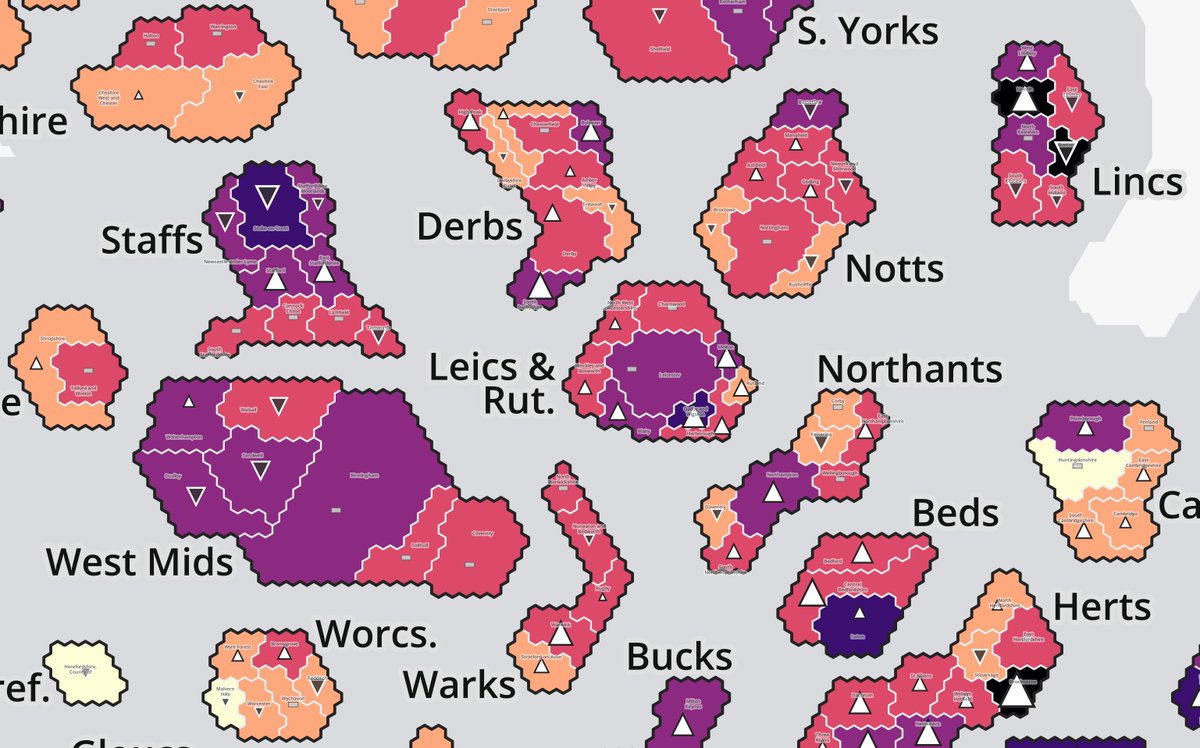
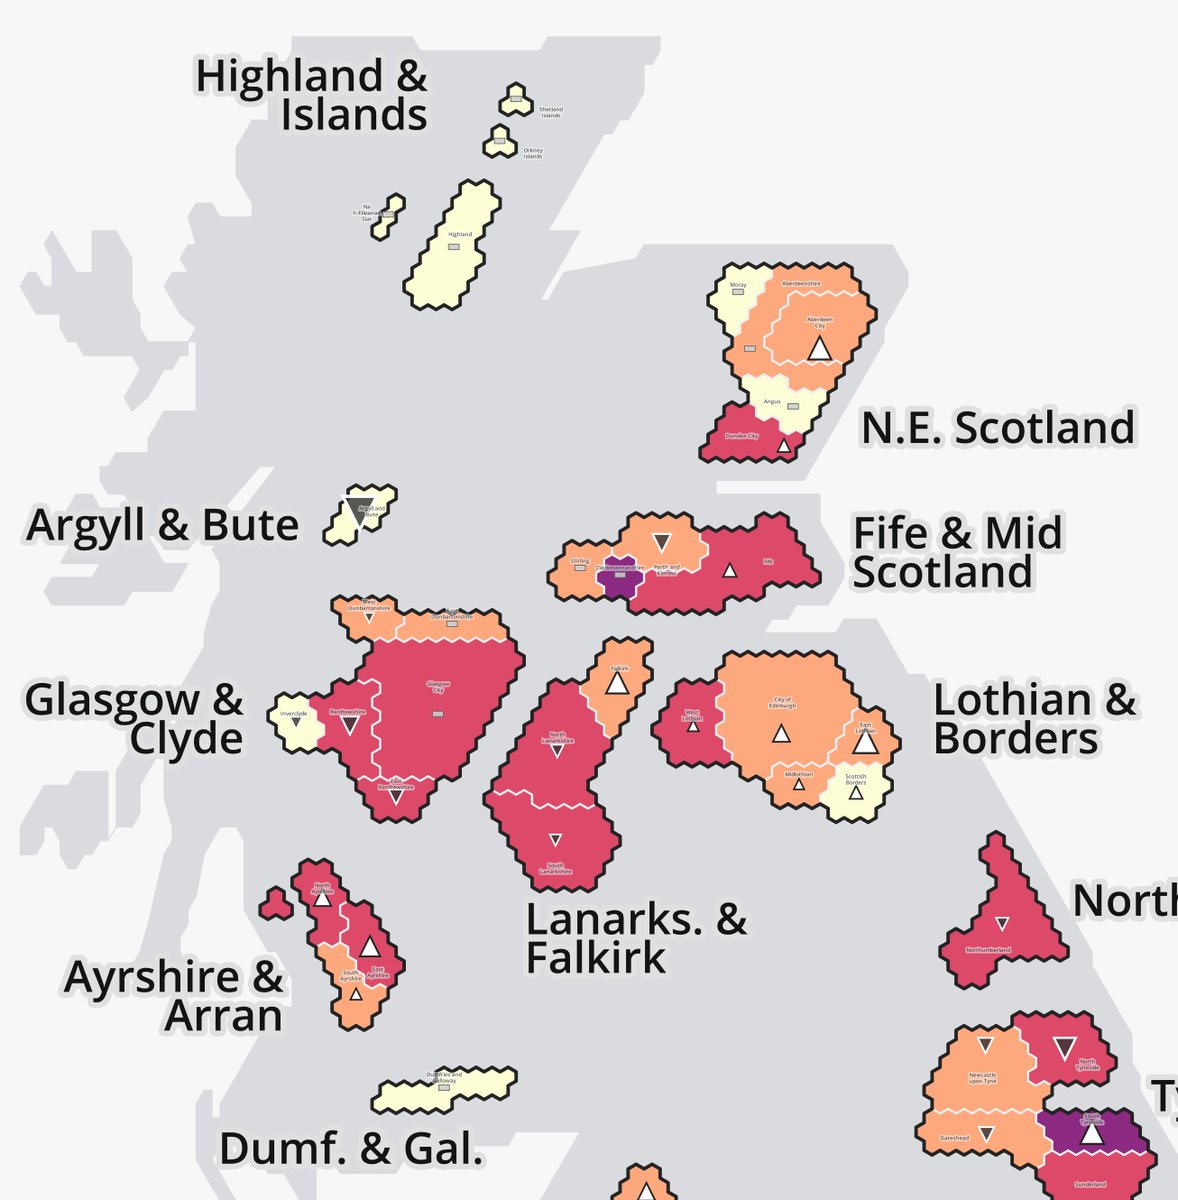
Rises in COVID-19 cases across Wales and SE England in the week to 9th Dec. Cases rising again in some Midlands/North areas but still falling in Yorks&Humber.
Areas are scaled in size by population and grouped by county etc. Direction and size of arrows shows weekly change.

Areas are scaled in size by population and grouped by county etc. Direction and size of arrows shows weekly change.


You can view a high resolution version of the cartogram here, which also includes labels for each local authority when you zoom in - to make it easier to navigate the map. https://drive.google.com/file/d/1VdmNwMVTsH3mF9JOuL4Q3aFg4Tv5iUP5/view?usp=sharing
Important context for the Wales figures here  https://twitter.com/statsjamie/status/1337793930713321473
 https://twitter.com/statsjamie/status/1337793930713321473
Every London borough shows a rise in cases in the week to 9th December, along with almost every local part of the surrounding counties in the East and South East. Not pretty.
The East Midlands counties all have some local authorities with rising cases in the week to 9th Dec. Fewer rises in the West Midlands, but cases remain relatively high in Birmingham & surrounds and much of Staffordshire.
In the North of England, areas with rising rates are still the exception and not the rule in the week to 9th Dec. They include South Tyneside, Midd'boro, parts of Lancs, and Cumbria. Still plenty of falls, although a bunch of places also have stable rates.

 Read on Twitter


