THREAD: A lot of people in political advertising & academia have been asking about the work we did @anotheracronym this cycle on engagement and persuasion. Here it is! https://www.anotheracronym.org/the-haha-ratio-learning-from-facebooks-emoji-reactions-to-predict-persuasion-effects-of-political-ads/
We field-tested over 100 messaging tactics in Barometer, in a series of rapid-turnaround field experiments. That volume of experiments allowed us get ad-level correlations between RCT estimates of persuasion & FB engagement, including reactions.
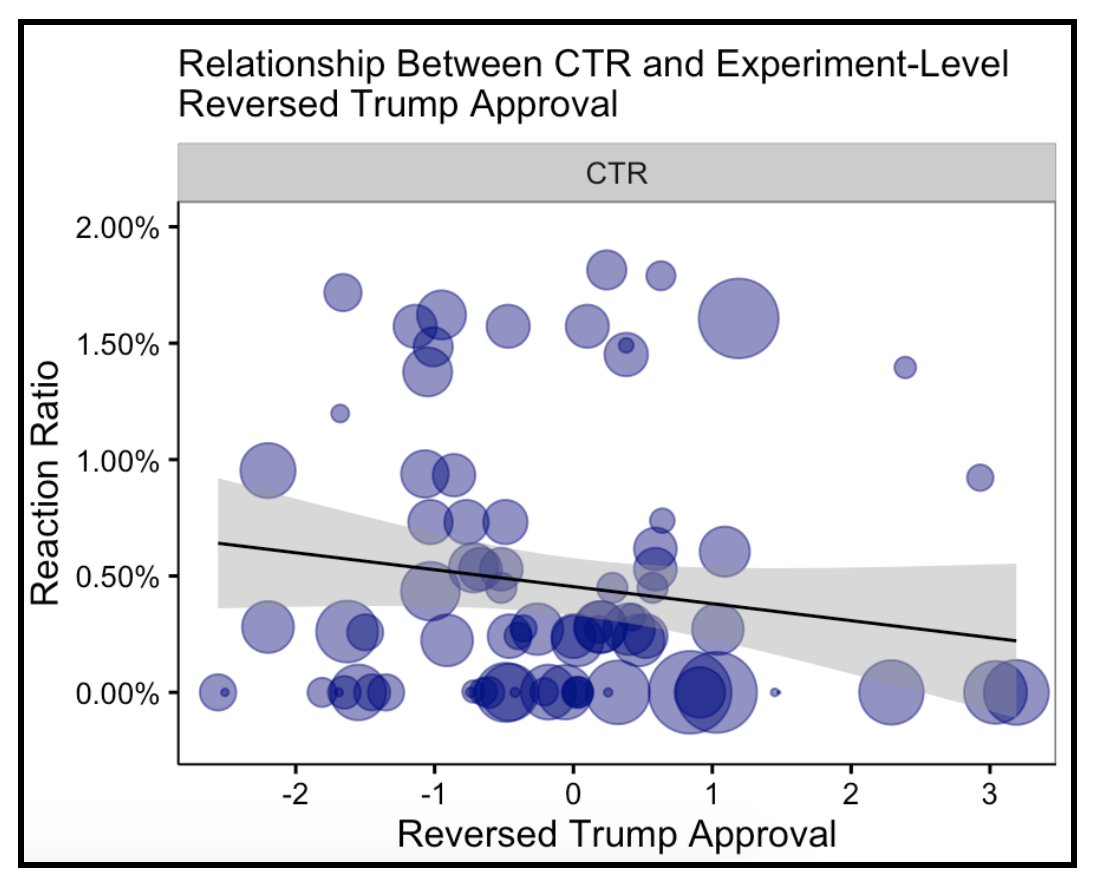
In work driven by @min0p0ly & @ZSylvan (follow them!), we replicated past work showing little relationship between persuasion & conventional measures of engagement like CTR (one example from @Swayable https://www.wired.com/story/viral-political-ads-not-as-persuasive-as-you-think/).
@jimmyeatcarbs's interest in getting a fast indication of whether an ad would backlash was the catalyst for this work. We couldn't get x-outs from FB ad engagement data, but we could get reactions. We wondered if they might hold the key to getting indicators of persuasion...
Because the team had seen first hand how state/country-level aggregates of emoji-reactions often corresponded with political events. Working from political science theory, we thought anger/negativity might be a key indicator of persuasion.
We also took a close look at some of our worst and best ads. We found that the ads that backfired on us seemed to have an unusually high number of “haha” reactions. I'd started off skeptical but we were starting to see promising results.
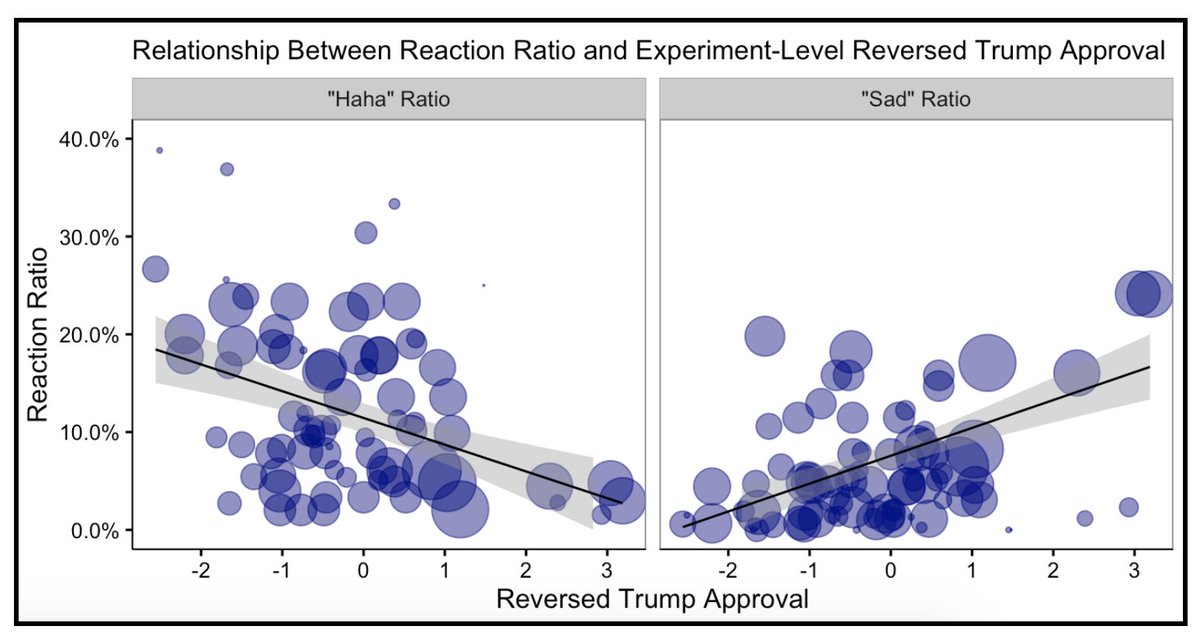
A correlational analysis confirmed it all: ads that prompted a negative emotional response, i.e. sadness or frustration, tended to be persuasive, while ads that garnered many haha reactions caused backlash. (x axis should say "treatment effect on Reversed Trump Approval")
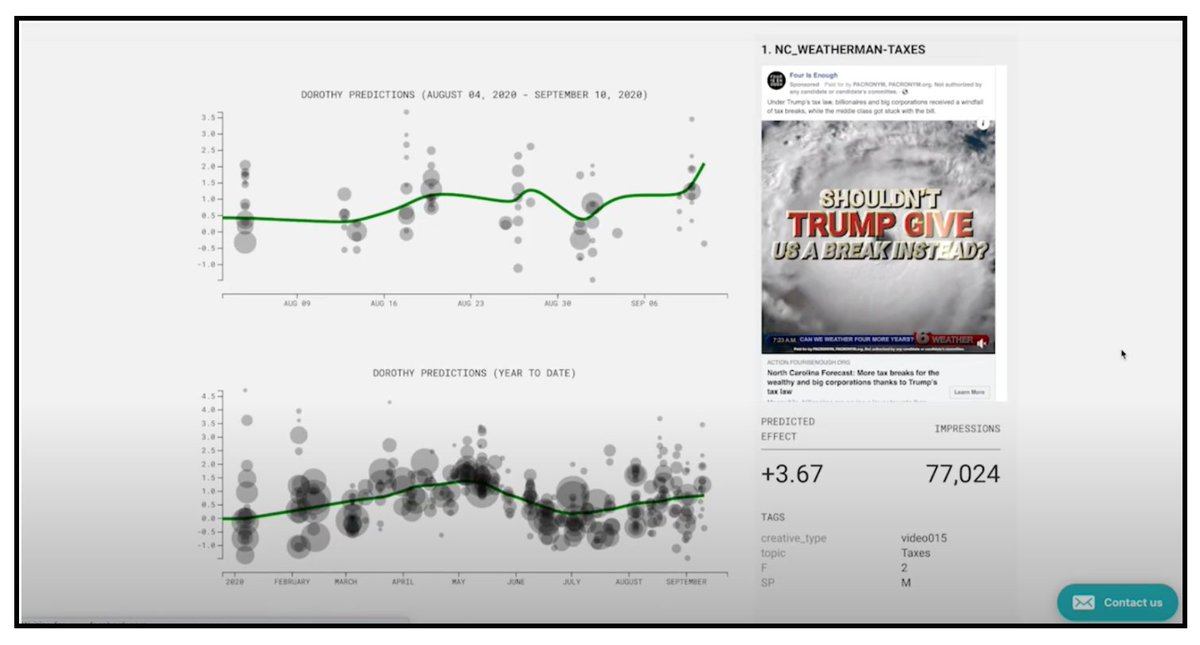
The strongest predictors (“haha”, “sad”) + a few weaker ones (“share”, “angry”) served as the basis for a model we used to predict the persuasiveness of an ad or boosted news story. We called it Dorothy (see post for more). It worked pretty well (LOOCV metrics below).
But could we use DOROTHY to identify persuasive news stories up front? In September, we used DOROTHY to do so. It found articles about the precarity of the Affordable Care Act (ACA & pre-existing conditions) would be highly persuasive in the wake of Ruth Bader Ginsburg’s passing.
DOROTHY’s prediction and the treatment effect observed in our experiment were relatively similar, further increasing our confidence in the model. We had a number of similar survey-experimental results.
We also built a dashboard that would take ad data and display DOROTHY predictions, and made it available to the progressive community. As of today, DOROTHY has been used to rank nearly 20,000 ads and articles across a dozen different organizations.
Huge thanks to @jimmyeatcarbs & @taraemcg for championing this work & to @kylewilsontharp for shepherding this blogpost out the door!

 Read on Twitter


