Covid and the labour market: we've new analysis today, showing how >5m workers were still away from jobs or on reduced hours at end of Sept- with worrying signs that crisis could be widening inequalities as jobs are shed in low paying work https://www.employment-studies.co.uk/resource/impacts-coronavirus-crisis-labour-market
Quick thread...
Quick thread...
Much of focus has been on furlough, but hours impacts (yellow) have been huge too. By end Sept, 1.6 million were working reduced hours. Three times greater than the fall in employment.
Job Support Scheme would have helped here, need to think far more abt how we help these workers
Job Support Scheme would have helped here, need to think far more abt how we help these workers
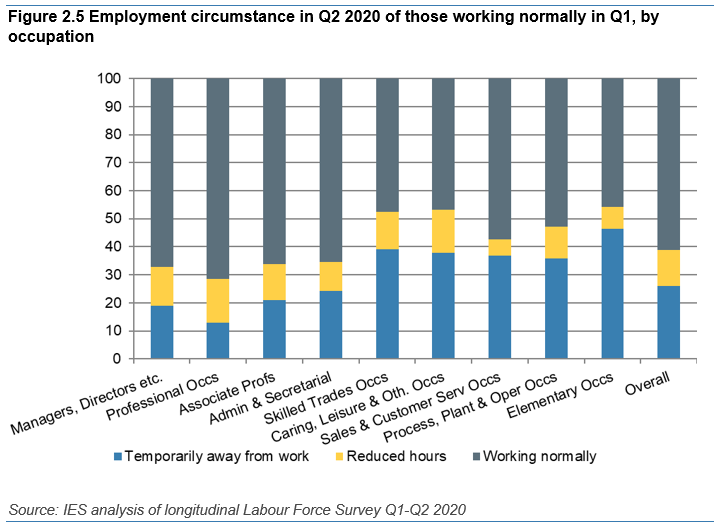
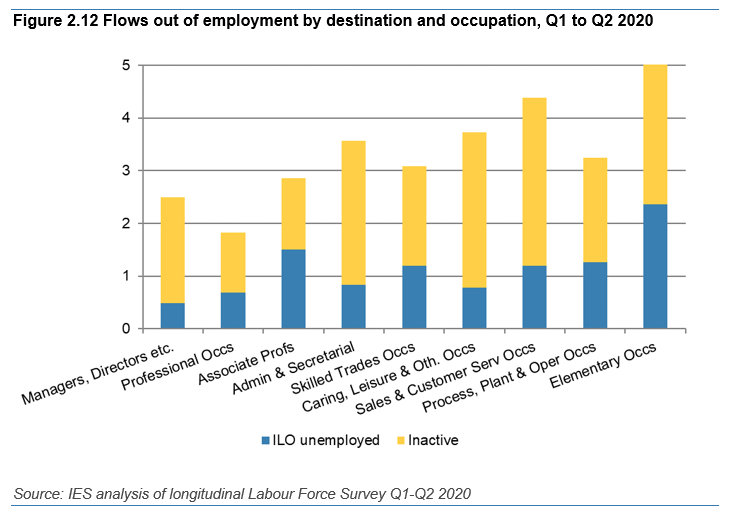
We knew there's a strong sectoral bias in the crisis, and this shows an occupational one too. Those in lowest paid work more likely to have work disrupted or lose jobs. Appears that skilled trades better protected thru furlough (the left pane below, while right shows job losses)
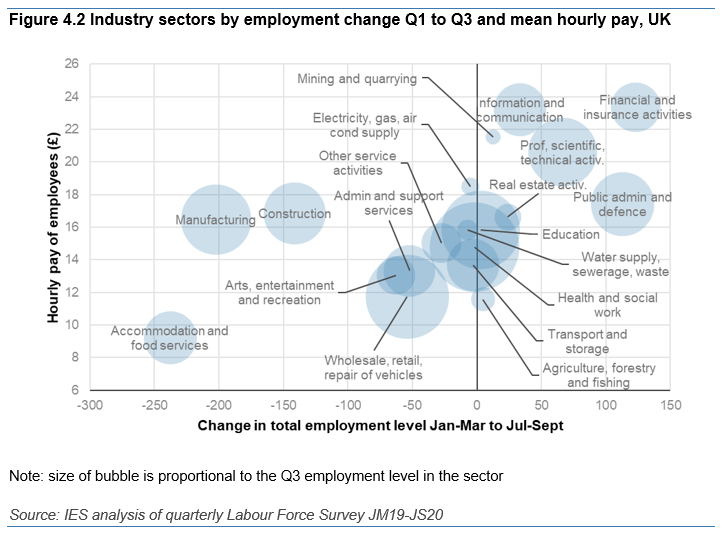
Looking in detail by sector and occ, striking how much of fall is food related, construction and elementary; and how much growth in professions.
[Wondered why manufacturing employment is down? All food manuf]
Many 'shutdown' jobs holding up ok cos of JRS, with sales jobs growing.
[Wondered why manufacturing employment is down? All food manuf]
Many 'shutdown' jobs holding up ok cos of JRS, with sales jobs growing.
The picture on professions and public sector is positive, and we've tried to visualise how jobs are growing in well paid services and falling in less well paid industries with lots of bubble charts like this one.
However... this doesn't quite tell all the story for two reasons.
However... this doesn't quite tell all the story for two reasons.
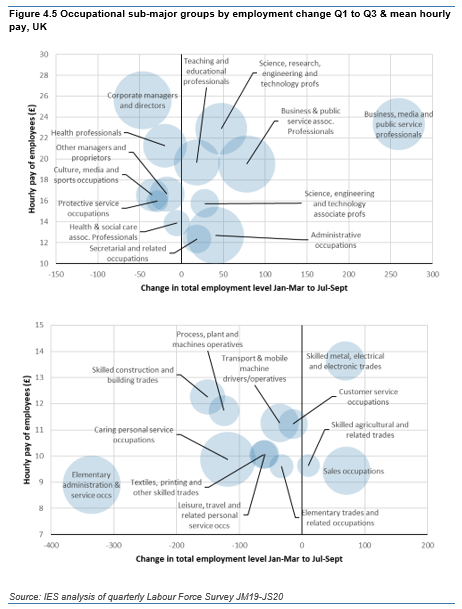
First, it looks like a chunk of the growth is pandemic jobs. e.g. public services and health are growing, but health PROFESSIONS are falling. Growth is all in mgt, admin and assoc professions. Likely cos of the vast jobs machine that is Test and Trace, plus local emergency jobs
Second, worrying signs that the shift could widen inequalities.
Many disadvantaged groups are over-represented where jobs are being lost and under-represented where they're being gained.
Our policy response - so far - is almost entirely ignoring the need to address this.
Many disadvantaged groups are over-represented where jobs are being lost and under-represented where they're being gained.
Our policy response - so far - is almost entirely ignoring the need to address this.
The groups we're most worried about are the very youngest, older people, disabled people, those with long term ill health and women.
Often different factors, but the common thread is being more likely to be out of work (esp. due to inactivity) and to be less secure when in it.
Often different factors, but the common thread is being more likely to be out of work (esp. due to inactivity) and to be less secure when in it.
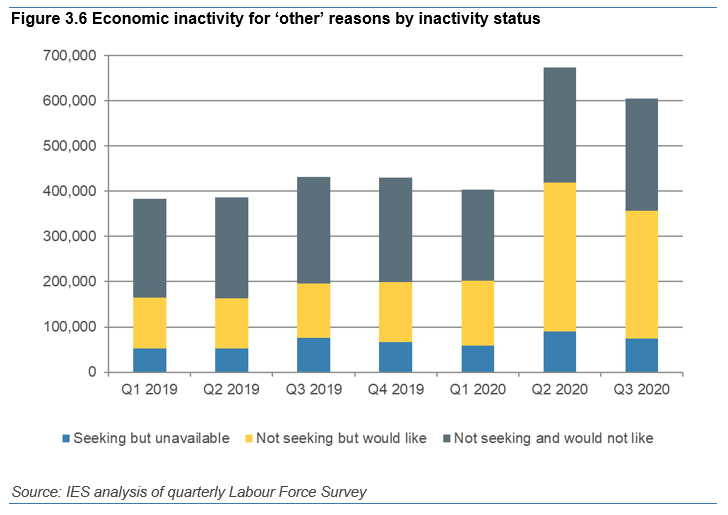
On inactivity, one stand-out has been the large growth in 'other reasons', where we find that the majority now want to work and may well be inactive due to pandemic-related reasons - e.g. no safe travel, usual jobs shut down, shielding themselves.
So what does this all mean? We think four takeaways for 2021. We need more:
1. For most disadvantaged - not just new unempl
2. For lowest paid/ least secure workers
3. To support above to get into jobs that are growing - where is ££ for retraining??
4. Support for new hiring
1. For most disadvantaged - not just new unempl
2. For lowest paid/ least secure workers
3. To support above to get into jobs that are growing - where is ££ for retraining??
4. Support for new hiring
Huge thanks to Matt Williams, @JamesCockettIES, Alma Boustati and De-Jon Ebanks Silvera for their work on this...
And just because the bubble charts are really cool, here's another one. Bottom left is low pay, falling jobs; top right is high paying rising jobs, etc...
And just because the bubble charts are really cool, here's another one. Bottom left is low pay, falling jobs; top right is high paying rising jobs, etc...

 Read on Twitter
![Looking in detail by sector and occ, striking how much of fall is food related, construction and elementary; and how much growth in professions.[Wondered why manufacturing employment is down? All food manuf]Many 'shutdown' jobs holding up ok cos of JRS, with sales jobs growing. Looking in detail by sector and occ, striking how much of fall is food related, construction and elementary; and how much growth in professions.[Wondered why manufacturing employment is down? All food manuf]Many 'shutdown' jobs holding up ok cos of JRS, with sales jobs growing.](https://pbs.twimg.com/media/EpMuol3XYAUzdQe.png)
![Looking in detail by sector and occ, striking how much of fall is food related, construction and elementary; and how much growth in professions.[Wondered why manufacturing employment is down? All food manuf]Many 'shutdown' jobs holding up ok cos of JRS, with sales jobs growing. Looking in detail by sector and occ, striking how much of fall is food related, construction and elementary; and how much growth in professions.[Wondered why manufacturing employment is down? All food manuf]Many 'shutdown' jobs holding up ok cos of JRS, with sales jobs growing.](https://pbs.twimg.com/media/EpMu2HqXYAERBA2.png)
