Virginia Vote Shifting Pattern - 2016 Edition: A key question raised in the 2020 election was about the large difference in top ballot races vs down ballot races. My analysis takes the votes of the Prez and subtracts the votes of the House candidate for Dems and Reps. Here's 2016
2. These figures come from the VA election results website. In 2016, the "Delta" column shows a surplus for Hillary, and a deficit for Trump in all districts except VA-3, VA-9, and VA-11. The highlighted row is VA-7 which we will examine more closely later in the thread.
3. The sum of the Trump deltas is a -171K votes. If we look at total VA votes for 2016, Hillary has 1,981K and Trump had 1,769K. A difference of 212K votes. So, correcting the shift means a Trump win in 2016.
4. When I originally did a similar analysis for 2020, I was under the impression / belief that any shifting would have been done by individuals outside of the election process, and most likely through external access over the internet. Given the damning affidavits recently,
5. I'm open to the idea that malfeasance within the election process could be responsible for this shifting pattern. The process for adjudication of ballots is especially ripe for abuse and could very well be the primary driver of this pattern.
6. For those not familiar, the "shifting pattern" can go either direction. Moving votes from Dem Prez to Rep prez and visa versa. It's a strong signal of manipulation, and is completely unnatural. One hallmark of this pattern is it's consistency across lower levels of data.
7. Several people said this pattern in 2020 was meaningless unless we were to compare results to 2016. I think they believe that if the pattern appears in 2016, then it's just the way the electorate vote in the state. I contend that it means that the same manipulation occurred.
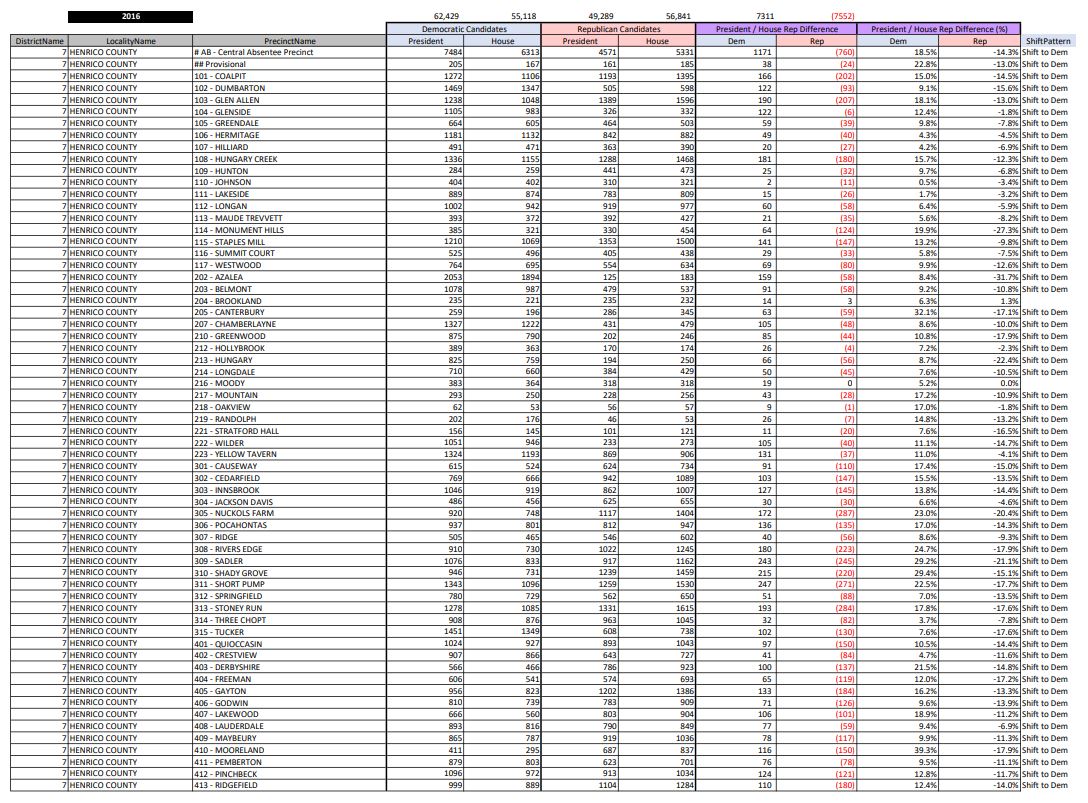
8. But lets look at some precinct level data in VA-7. Henrico County has many red flags in the 2020 election. Here's the result of the analysis! 67 of 69 precincts have votes shifted from Trump to Hillary. The symmetry of surplus and deficit is stunning.
9. The consistency and symmetry of this pattern is in no way a natural result of the electorate. It is only possible when viewed as the result of a manipulated process. A natural result would have variation and differences. That's not what we see in the data!
10. Hillary had high negatives in 2016. Especially with R's, but we are to believe that R's defected in large numbers to vote for her at the top of the ballot, and stay true down ballot. That's simply not believable. The narrative in 2020 is that R's soured on Trump.
11. What is the narrative for 2016? R's strongly supported a third term of Obama? Trump was too much of an unknown for many R's? Nonsense. R's knew what a Hillary presidency would mean, and were much more comfortable with the risk of Trump, than the guaranteed of Hillary.
12. If we were to set aside manipulation, there are only a couple possibilities to "naturally" explain such a pattern. Let's explore them : 1. D's don't vote down ballot and R's don't vote up ballot. 2. Only R's are split ticket voters. Neither of these are realistic!
13. So what are we left with? Deeply troubling concerns about the integrity of our election processes and the officials who run them. Something is rotten here. I hope to find answers.
@threadreaderapp unroll

 Read on Twitter


