This article tries extremely hard to blame college students for COVID deaths, but it's so full of weird qualifiers and suspicious statistics that I went to check the underlying data. And it really doesn't bear this story out. (thread) https://www.nytimes.com/2020/12/12/us/covid-colleges-nursing-homes.html
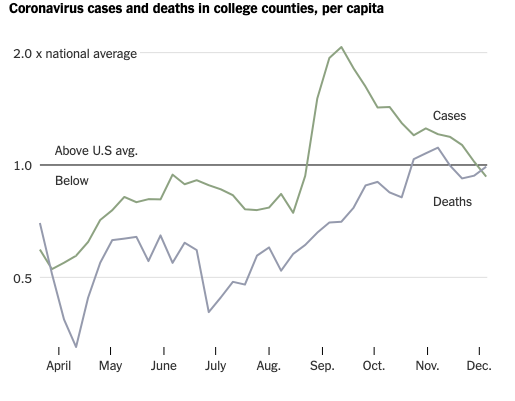
First off, the central chart is too cute by far. Saying the rate of cases doubled in college counties sounds persuasive--but another way of putting these numbers is that today, in early December, college counties are exactly in line with the national averages for cases and deaths
It's clear there that there was a spike in positive tests in September as classes started. But deaths rose far more in those counties July-to-September than October-to-December, which doesn't square with a story that students seeded outbreaks in on September 1.
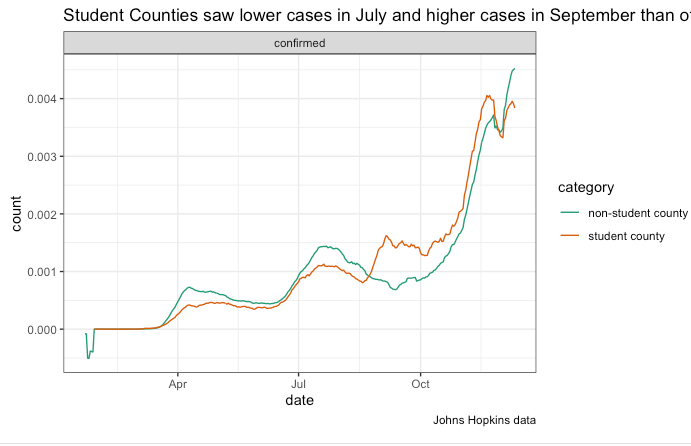
Pretty sure I've got the same 203 counties as the Times, so here's a clearer way of putting the per-capita case count using Hopkins data. After a spike when colleges began testing, college counties largely stayed just ahead of non-student ones.
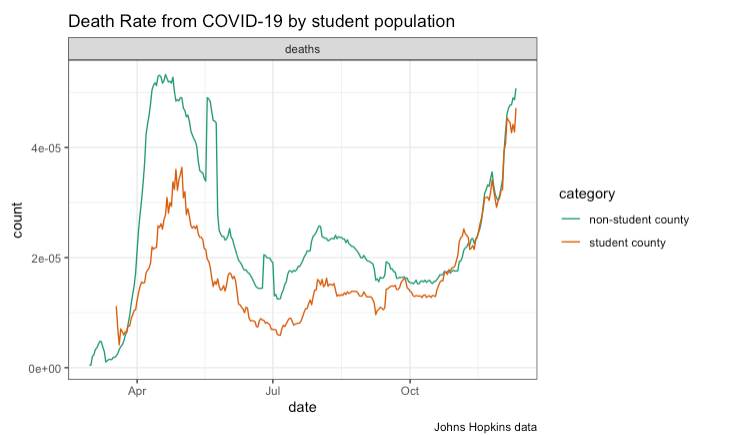
And here's the death rate. Student counties look **EXACTLY THE SAME** as the rest of the country in their death rates since October 15 or so--they just were lower in the summer and spring, which the Times uses as its baseline for these comparisons.
And it's not mysterious why college towns as opposed to meatpacking towns or prison towns saw lower corona rates in the spring and summer: COLLEGE WASN'T IN SESSION. Many of those students were probably not there; those that were were doing online classes.
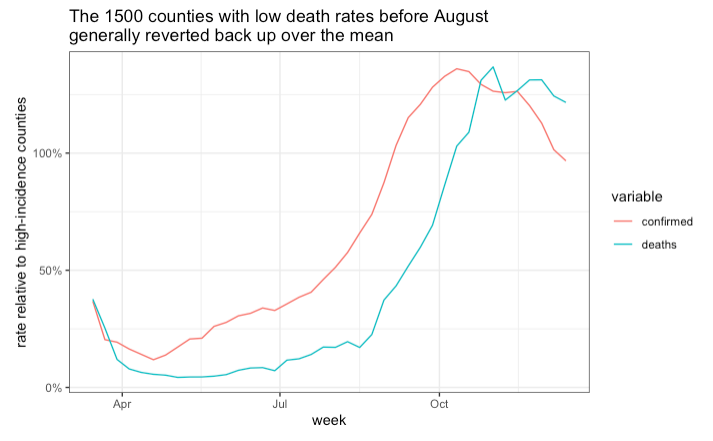
Because we are in uncontrolled, nationwide pandemic, every class of counties that looked good in the spring and summer has regressed back to the national mean. Say we just look at the 1500 counties w/ low death before August 30. Things reverted in them too.
And the places that had high COVID rates in the summer were in the sunbelt, the part of the of the US that has the fewest colleges. Let's look at a dummy set for each of the 203 college counties--the county in the same state next to it. Here's the Times' chart w/ Hopkins data...
And here are the rates in 203 counties next to college counties in population rankings within each state (i.e., not next geographically, just similar w/o the college). Positives didn't spike in these counties, but deaths went up MORE than in the comparable college counties.
A better story than the Times' one: colleges tested aggressively in Sept., so case rates artificially skyrocketed; but despite those positives, they've done no worse (slightly better?) in the 3rd wave than other similar counties.
Are 20 year-olds reckless? Sure. Has in-person college made the counties where colleges are considerably more dangerous? I doubt it. (You'd probably need some regressions to be sure--there are probably fewer old people where college students are, etc.)
But the Times clearly had this conclusion pre-written when they started their big college corona tracker months ago, and they've completely missed the real story, which is that the panic of September seems not to have born out. https://twitter.com/silbey/status/1338188417163784193
(Not to mention that 20 year olds, who are probably meeting up whether or not they're in college, must be doing less damage in dorms than they'd be if they were doing while living with parents. I worry much more about sending students home in March/April w/out testing.)
I care enough to check this because it's part of a larger, perfidious genre of stories about COVID we've seen since March--using lazy statistics to degrade activities that the writer thinks are unnecessary luxuries. Beach, bars, college, church, motorcycle rallies, etc.
And exacerbating fault lines in existing communities while doing so. It's all just those dirty Chinese/liberals in cities/students/bikers/republicans without masks/etc that are to blame for this mess--if only everyone were like *us*, things would be fine.

 Read on Twitter


