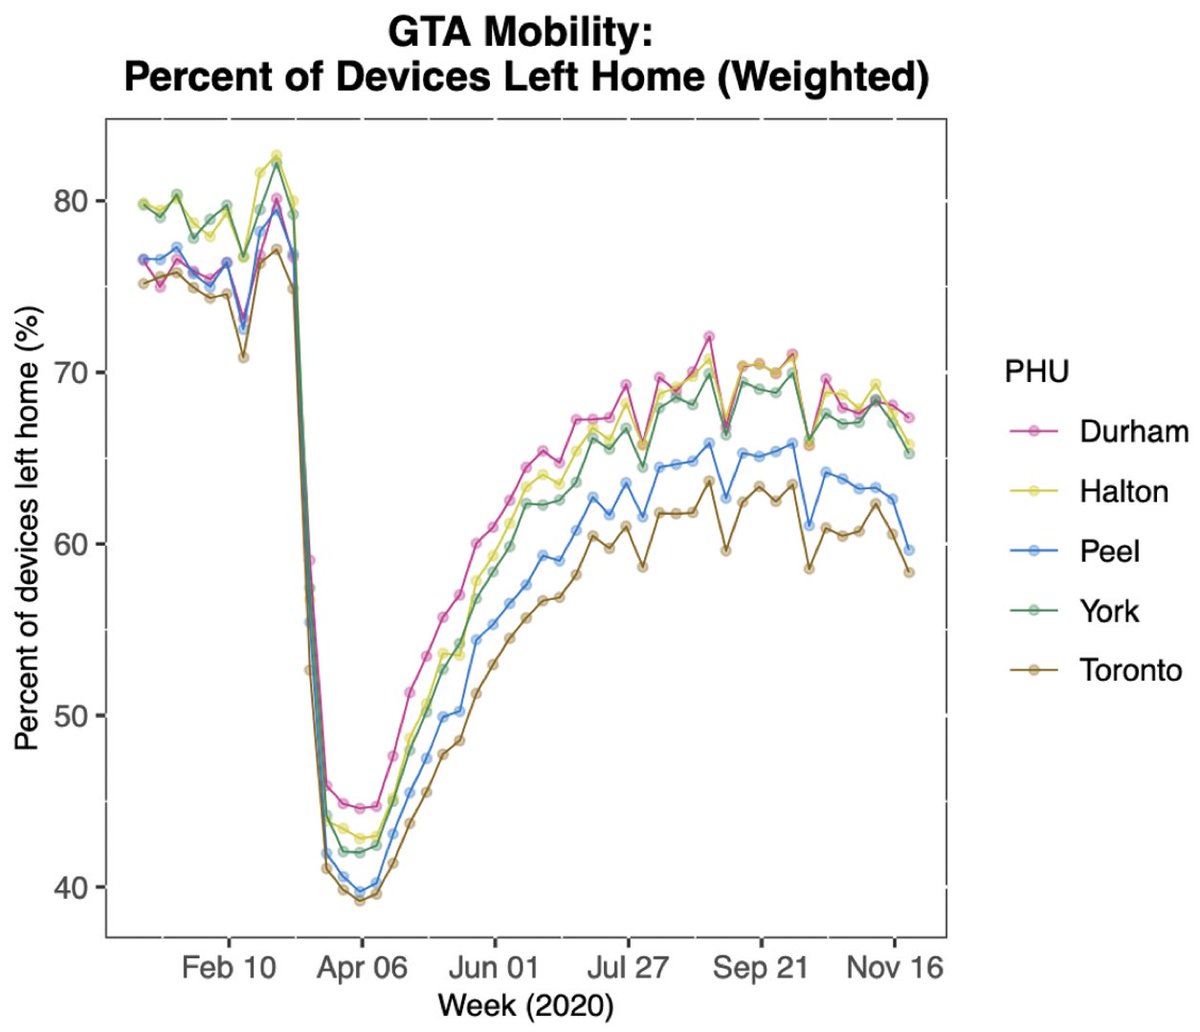
Yesterday, the Science Table Advisory for Ontario had a press briefing where they showed the latest Ontario #COVID19 data. One of the figures was Ontario’s Google mobility data
#Coronavirus #lockdown #pandemic #science #data #Canada #COVID19ontario #cdnpoli #onpoli
#Coronavirus #lockdown #pandemic #science #data #Canada #COVID19ontario #cdnpoli #onpoli
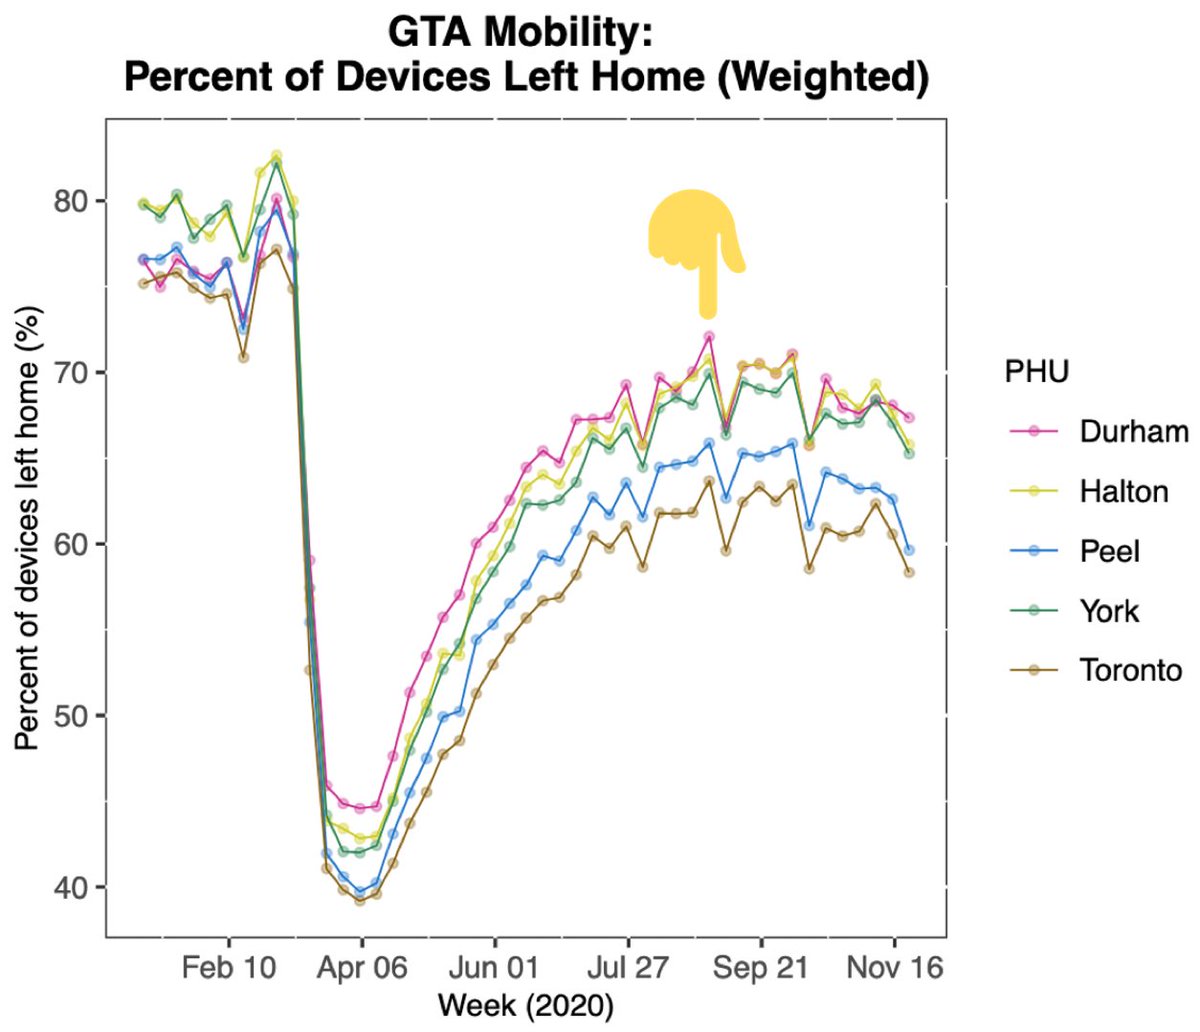
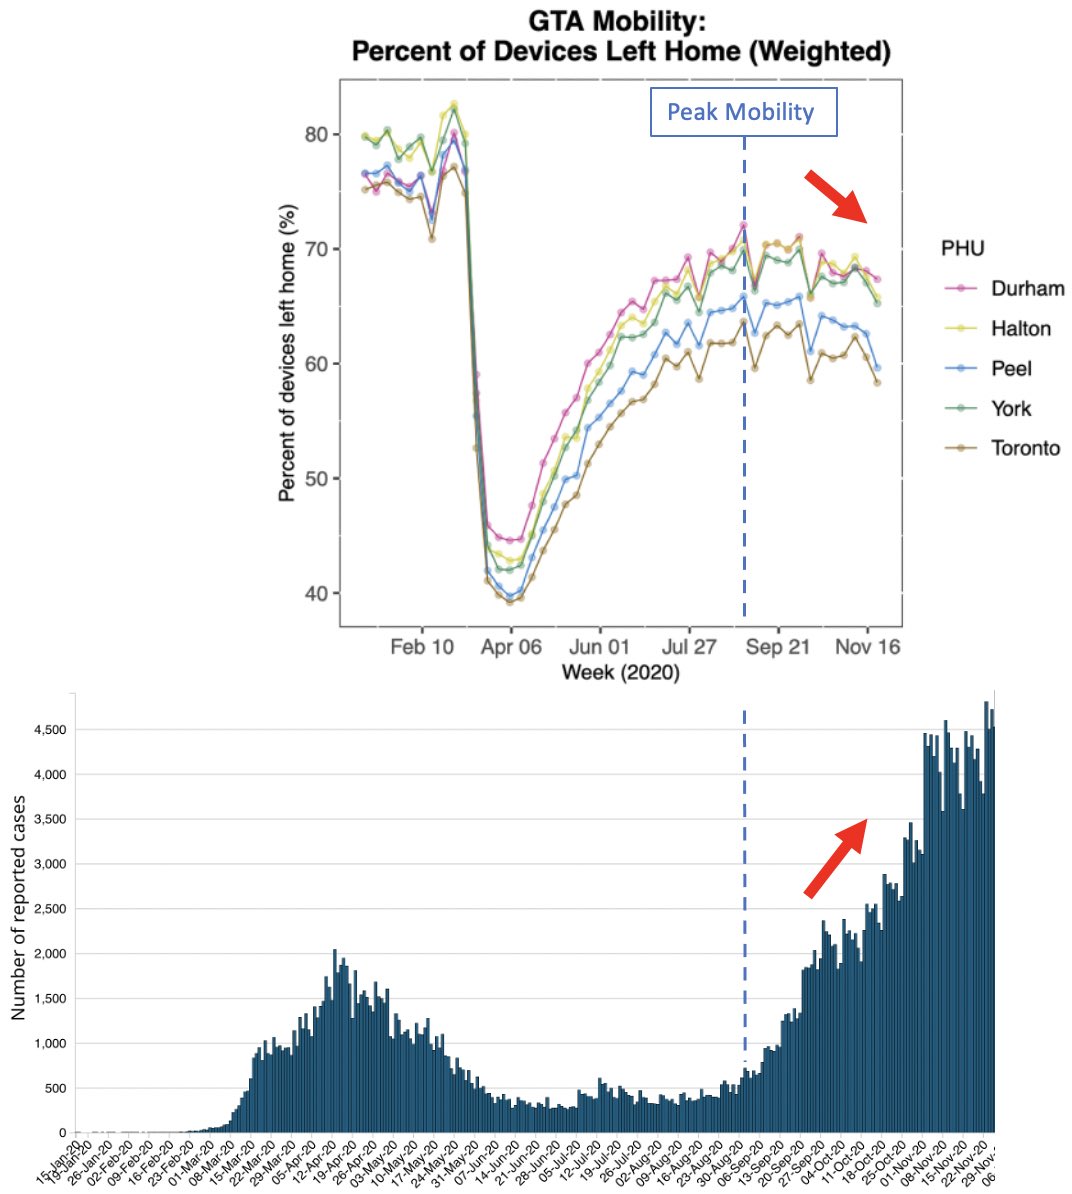
People’s mobility peaked around end of August/early September & then started a gradual downwards trend. Was there any effect of this gradual decline in mobility on the number of cases in Ontario?
#COVID19 #Coronavirus #lockdown #pandemic #science #data #Canada #cdnpoli #onpoli
#COVID19 #Coronavirus #lockdown #pandemic #science #data #Canada #cdnpoli #onpoli
Clearly, there was no effect of reducing mobility after it peaked, on number of cases. And remember in summer, people’s mobility increased while number of cases decreased.
#COVID19 #Coronavirus #lockdown #pandemic #science #data #Canada #COVID19ontario #cdnpoli #onpoli
#COVID19 #Coronavirus #lockdown #pandemic #science #data #Canada #COVID19ontario #cdnpoli #onpoli
So people’s mobility seems to have an almost opposite affect on the number of COVID-19 cases. Lockdowns don’t work.
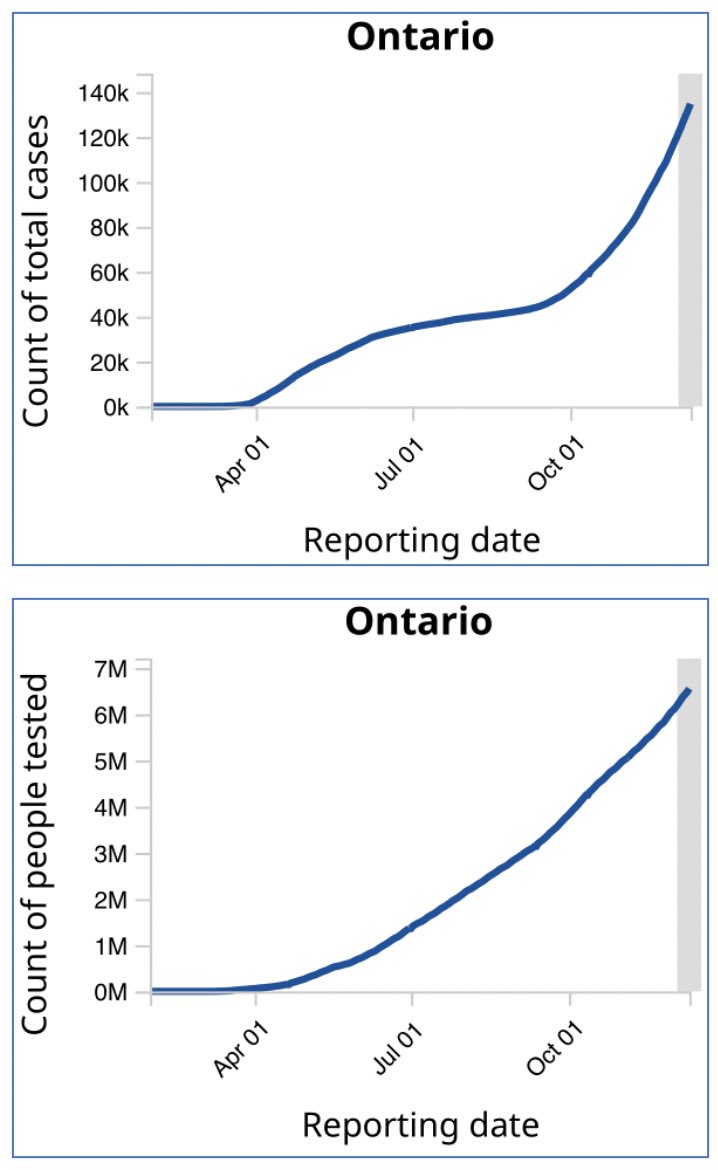
But is there any variable that actually has a positive relationship with the in # of cases? Yes, there is one that has an almost perfect correlation: Testing.
But is there any variable that actually has a positive relationship with the
 in # of cases? Yes, there is one that has an almost perfect correlation: Testing.
When you put graphs for number of cases & number of tests on top of each other, you see an almost perfect relationship.
#COVID19 #Coronavirus #lockdown #pandemic #science #data #Canada #COVID19ontario #cdnpoli #onpoli
#COVID19 #Coronavirus #lockdown #pandemic #science #data #Canada #COVID19ontario #cdnpoli #onpoli
It’s not people’s mobility that is driving a rise in cases, it is the indiscriminate & endless use of a test with a flawed protocol (PCR) on mostly asymptomatic people that is responsible for the increase in cases. Oh, & all this testing is costing us billions of dollars 


 Read on Twitter


