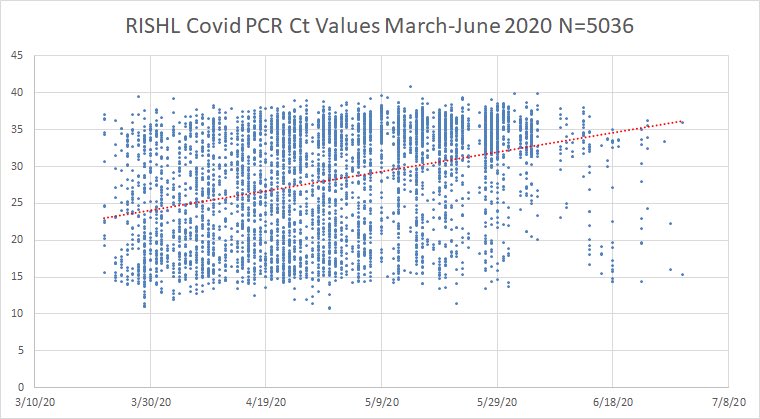
PCR Ct data revealed! For the first time we get a look at the Ct values from a state health lab - these cover March-June 2020. First the scatter of all 5036 positive tests:
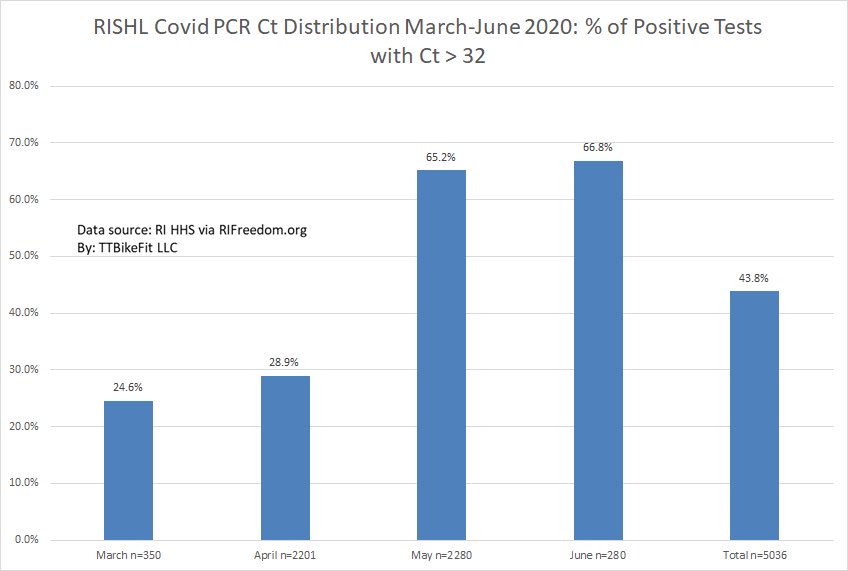
Finally, the temporal shift in percentage of tests with Ct > 32 (arguably a fair cutoff for infectious viral loads).
We can see even during the peak pandemic months 25% of tests were > 32 - and this was when mainly symptomatic folks were tested. In May-June as many as 2/3 of tests were non-infectious. The virus was waning AND testing protocols changing.
So we have clear indication that over the entire period, at least a quarter of tests were effectively false positives, with as many as 2/3 being false positives in May/June.
And the temporal shift in Ct distributions should be highly valuable in tracking the disease. Certainly these data are very important yet accessing it is extremely difficult! Why?
Thanks to http://RIFreedom.org @andrewbostom for the data! We need more of this!

 Read on Twitter


