Today's data: national balance sheets for Q3!!  https://www150.statcan.gc.ca/n1/daily-quotidien/201211/dq201211a-eng.htm?HPA=1
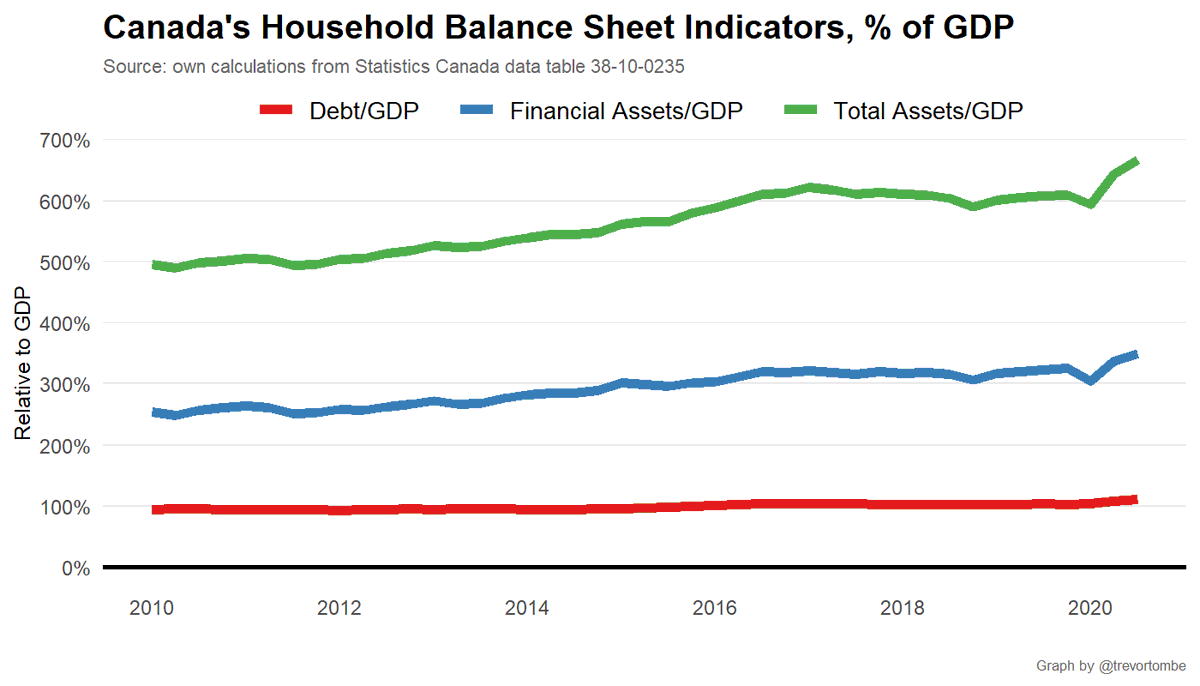
Household debt reaches all time high, but an under-reported statistic is that financial and total assets have also reached new highs. #cdnecon
 https://www150.statcan.gc.ca/n1/daily-quotidien/201211/dq201211a-eng.htm?HPA=1
Household debt reaches all time high, but an under-reported statistic is that financial and total assets have also reached new highs. #cdnecon
This matters since many will see the riding debt as a sign over 'overleverage', but this isn't necessarily true. I'll paint a more optimistic picture here.
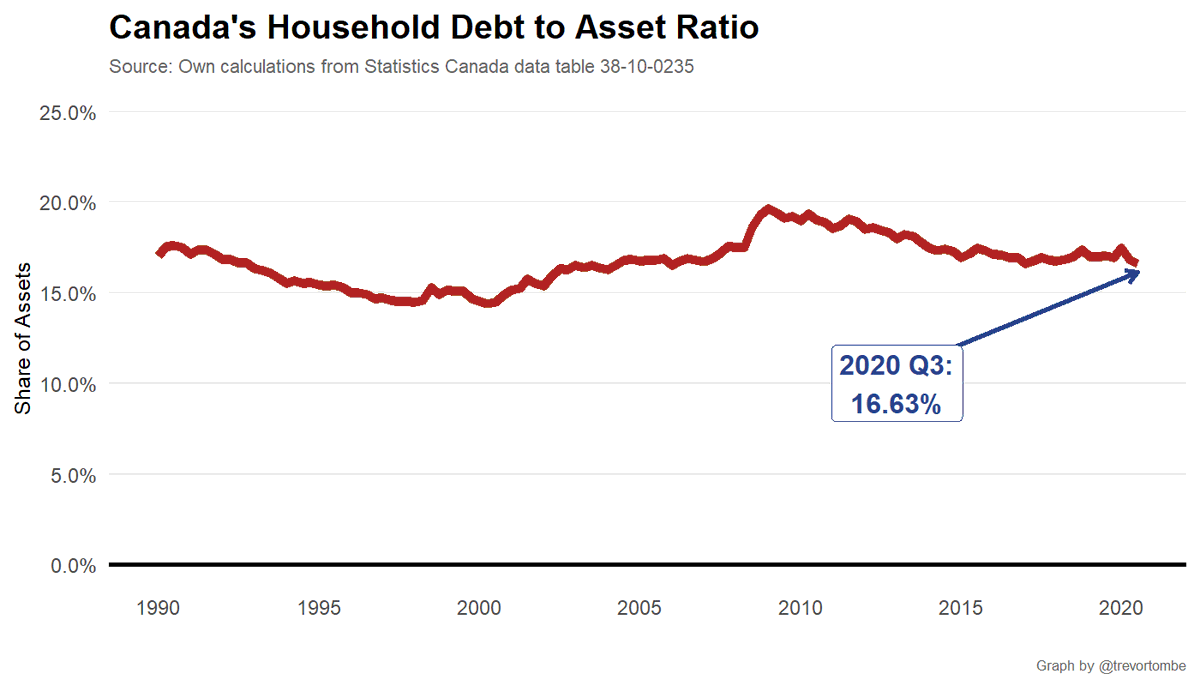
First, debt as a share of assets are very much in line with historical norms.
First, debt as a share of assets are very much in line with historical norms.
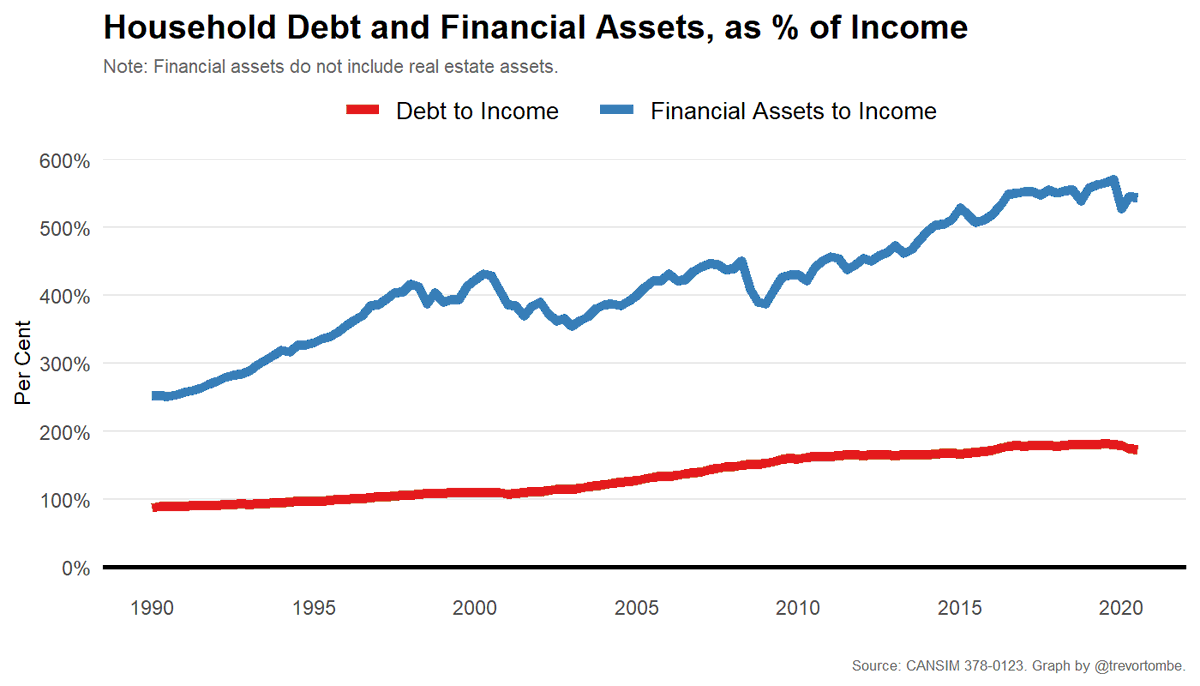
Second, the "household debt is 173% of income" headline is correct. But financial assets (which doesn't include homes, for example) is 544% of income!
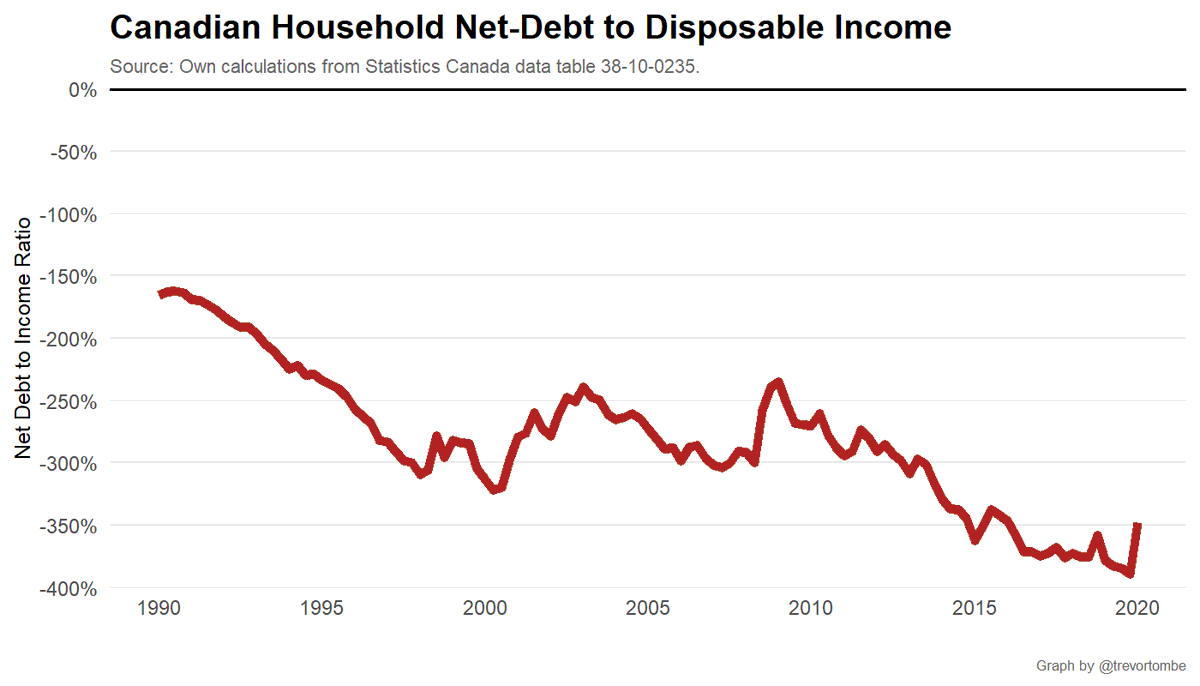
So, instead of "debt" let's look at "net debt". Household net debt as a share of disposable income is actually highly negative. -350%.
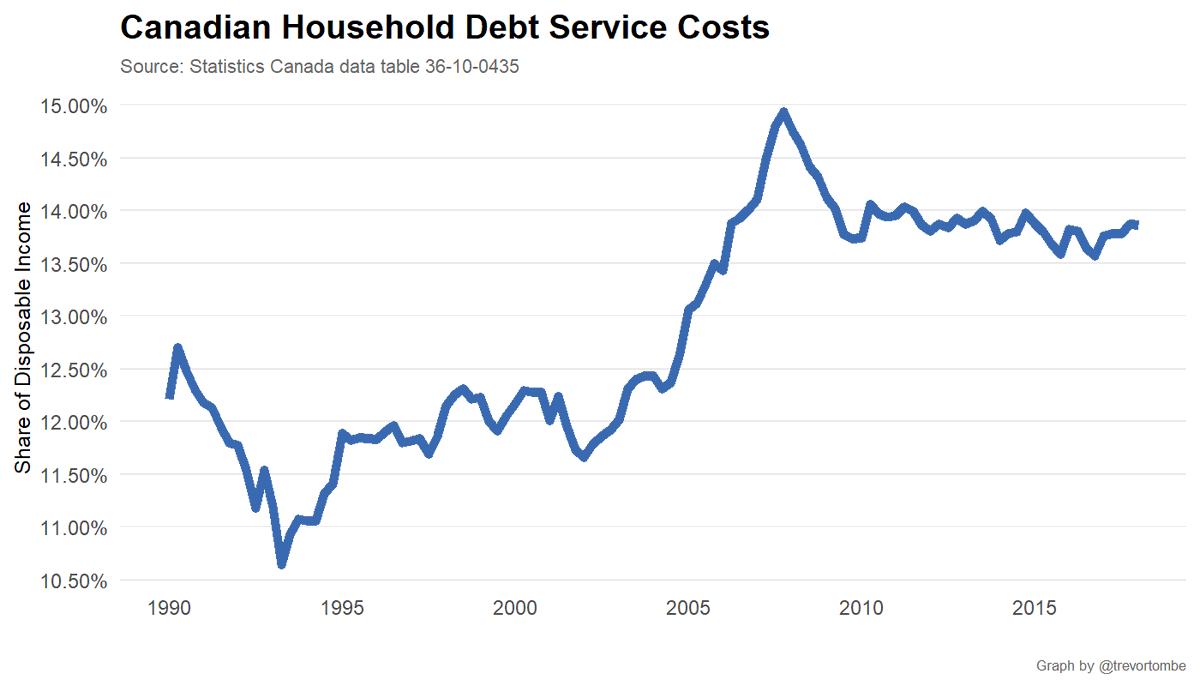
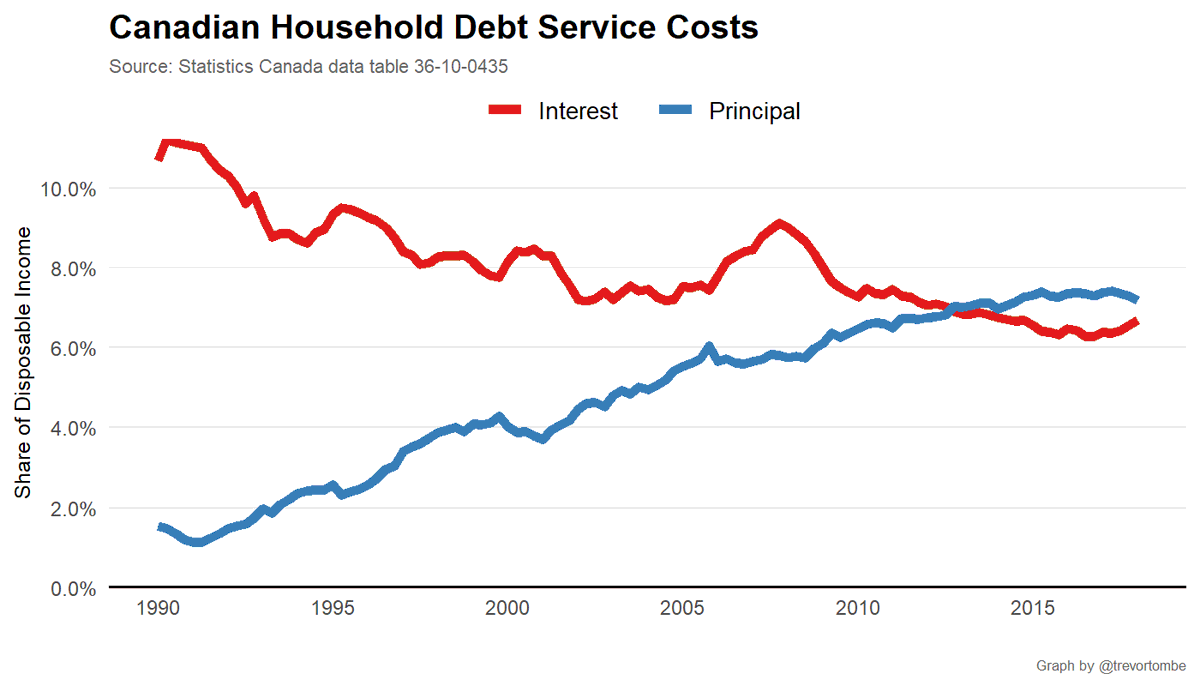
Debt service ratios are an interesting statistics to look at too. Here we see that recent years have remained stable, though notably higher than pre-financial crisis.
.... BUT
.... BUT

 Read on Twitter