Exposing and explaining the deeply flawed and deliberately misleading use of statistical concepts in the Texas lawsuit filed in #SCOTUS: a thread.
It’s a long one, so get ready to dive in and figure out where that 1 in a quadrillion number came from and why it’s totally wrong!
It’s a long one, so get ready to dive in and figure out where that 1 in a quadrillion number came from and why it’s totally wrong!
First, some disclaimers:
- I am not a lawyer. I am a statistician.
- I did this analysis in my free time.
- Any opinions are mine alone.
I was encouraged to do this thread by my partner @jssmatt, who actually is a lawyer!
- I am not a lawyer. I am a statistician.
- I did this analysis in my free time.
- Any opinions are mine alone.
I was encouraged to do this thread by my partner @jssmatt, who actually is a lawyer!
The complete text of the declaration I analyze is available here, from page 1a-10a (20-29 of the PDF): https://www.supremecourt.gov/DocketPDF/22/22O155/163048/20201208132827887_TX-v-State-ExpedMot%202020-12-07%20FINAL.pdf
I only use vote counts and percentages that are in this document, and I assume they are all correct as presented in the document.
I only use vote counts and percentages that are in this document, and I assume they are all correct as presented in the document.
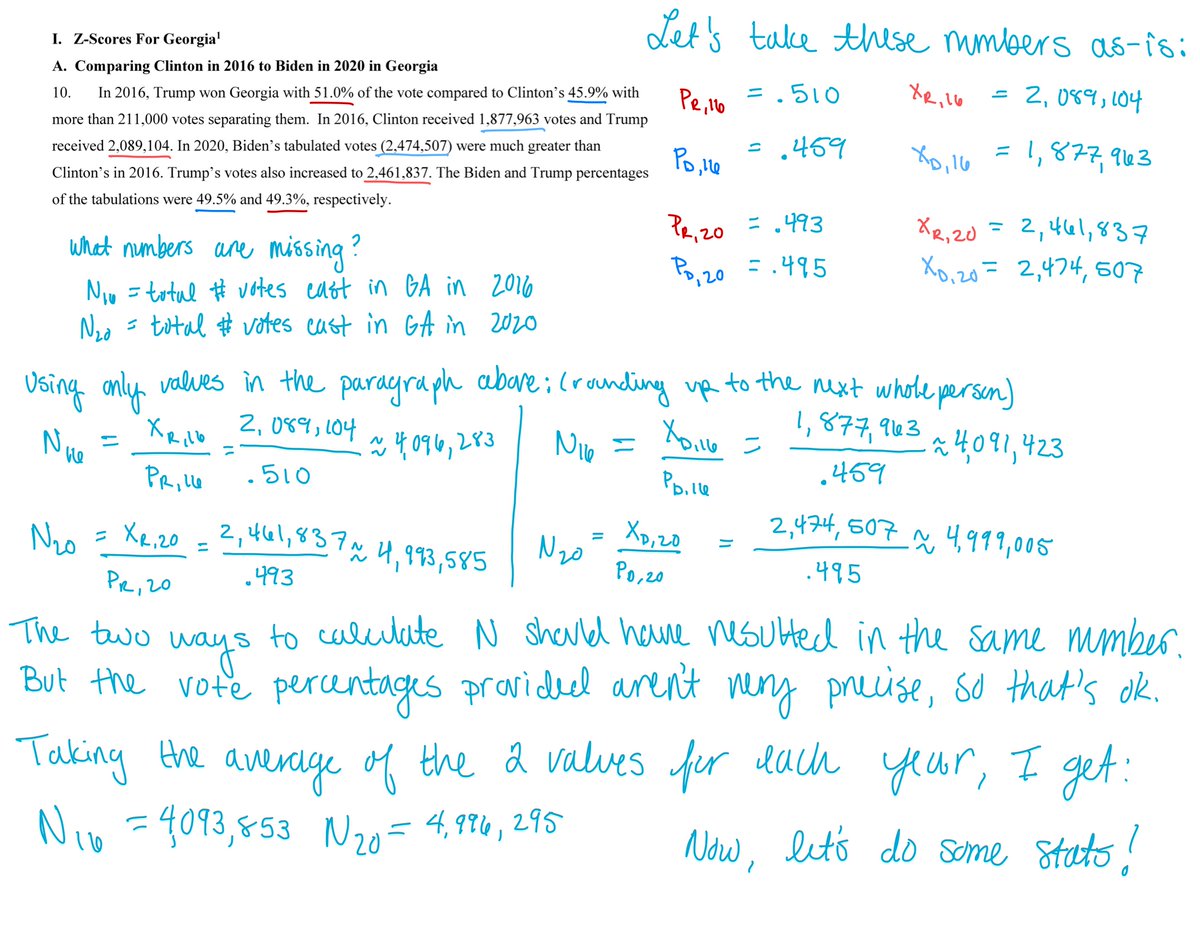
Let’s get started where the math and stats start, on page 3a, para 10. These numbers set us up to get the infamous 1 in a quadrillion value. Since we’re only dealing with the votes for president, I use D to represent the Dem. candidate and R to Represent the Republican candidate.
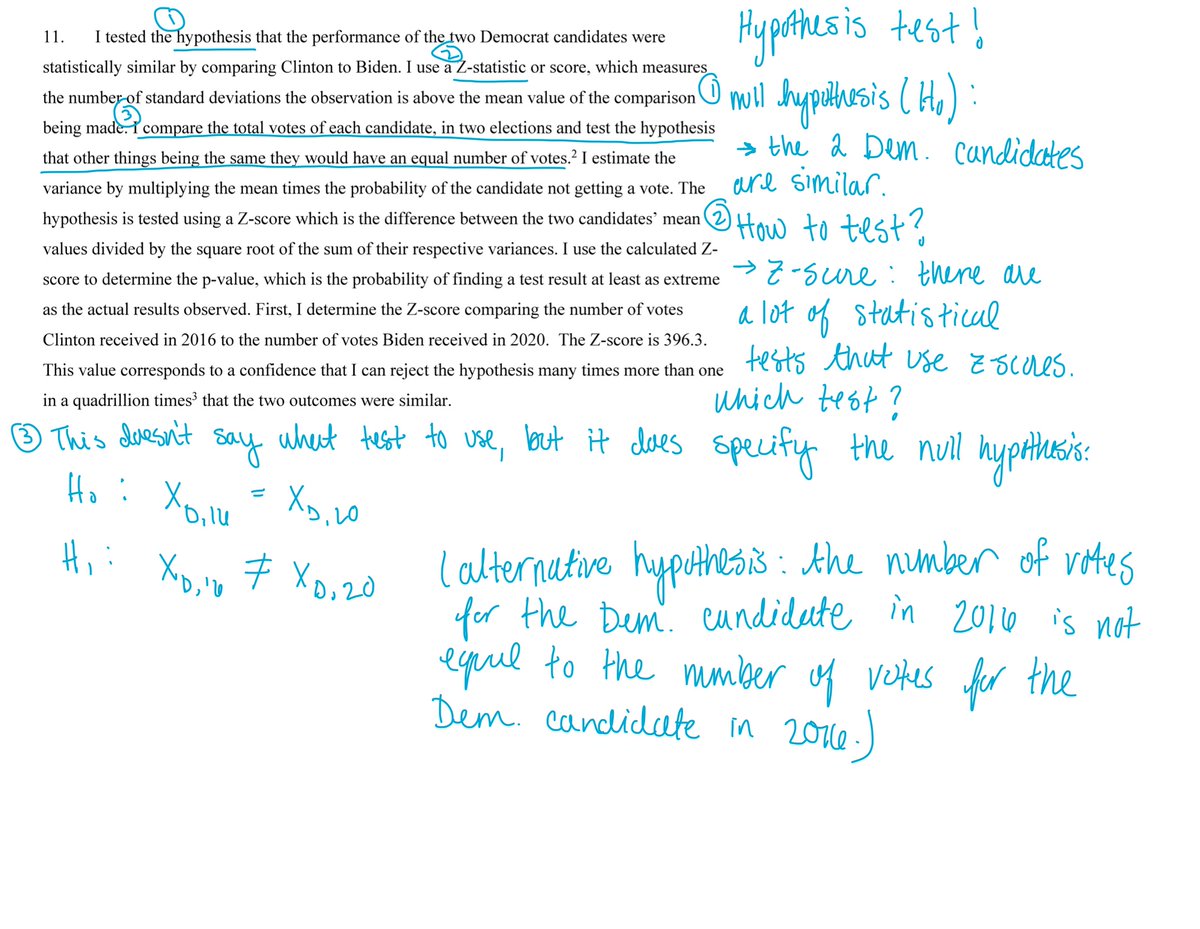
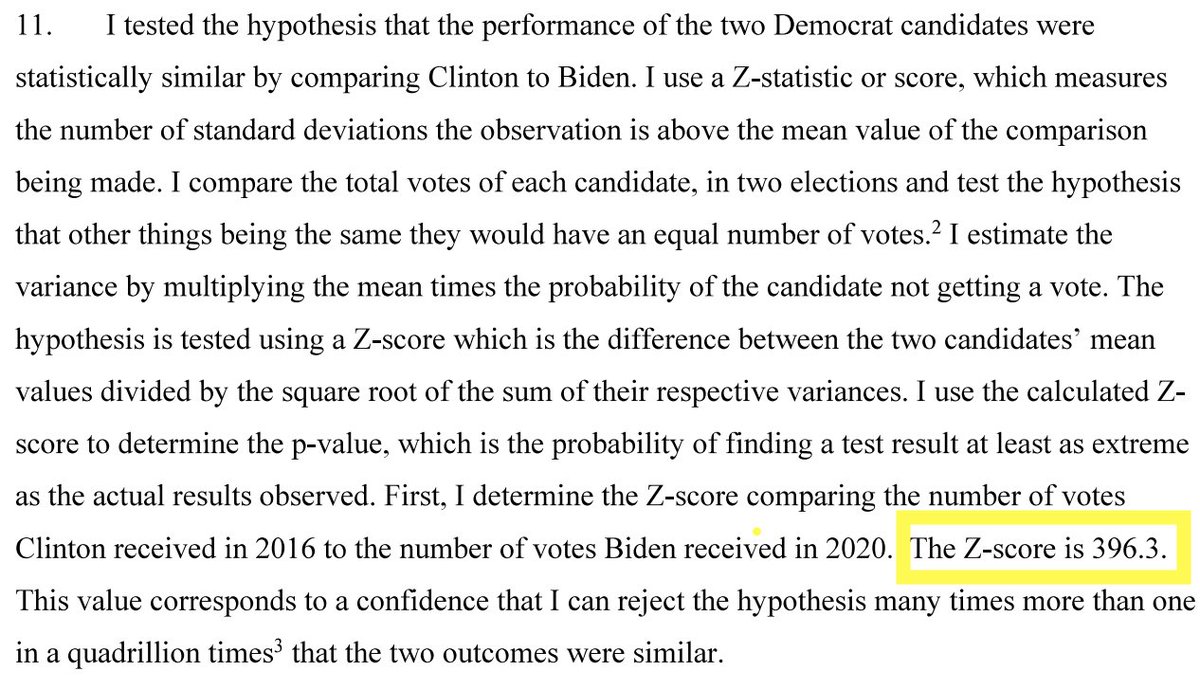
Next up: paragraph 11. The first 2 sentences present the question of interest (how similar were the vote counts for the Democratic candidate in 2016 and in 2020, and how the author proposes to answer the question (with a z-score)
STAT 101 refresher: A z-score is a common statistic used in hypothesis tests, but just saying “z-score” can’t imply any one stat. test, because they're used in a lot. For example:
2-sample test for equality of population proportions https://online.stat.psu.edu/stat800/lesson/5/5.5
To name only 1.
2-sample test for equality of population proportions https://online.stat.psu.edu/stat800/lesson/5/5.5
To name only 1.
In statistical hypothesis testing, there is always a null hypothesis and an alternative hypothesis. In a 2-sample test for equality of population means, for instance, the null hypothesis is always that the means of 2 populations are equal.
The alternative hypothesis then could be that the 2 means are not equal, or that one is greater than the other, whichever is most of interest to you. It’s really important to set up your hypotheses properly before any calculations are performed! https://en.wikipedia.org/wiki/Statistical_hypothesis_testing
Back to paragraph 11. By the 3rd sentence of paragraph 11 things start to get weird. (That didn’t take very long…) It implies that the null hypothesis in the analysis is:
The two observed values for number of votes earned by the Democratic candidates in 2016 and 2020 are equal
The two observed values for number of votes earned by the Democratic candidates in 2016 and 2020 are equal
STAT 101 refresher: the field of statistics is fundamentally based on the fact that we rarely know the true population-wide values we want to know. For example, we cannot know the average height of all adult men in the US at a given time.
Why? It’s impossible to measure the height of all adult men in the US simultaneously and compute the arithmetic mean of all ~100 million or so of those values. In addition, the population of US adult men is changing every day. The average height of all men in the US is unknowable
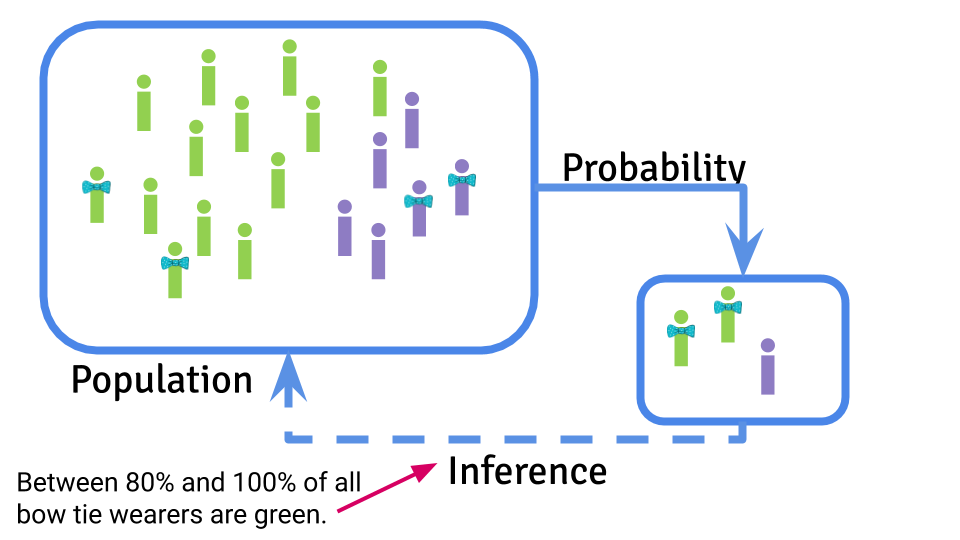
But, if you ask Google, the answer is 5’9”. Why? Because of statistics. Statistical inference, part of which is hypothesis testing, is concerned with taking samples from populations to estimate unknowable population-level values. Image from @jtleek
In rare cases where we do have information from all members of a population, that is called a census, and we can get true population values. No statistical inference is required!
When determining the results of an election, the population of interest is all correctly cast ballots (meaning all ballots that were filled out legibly, and not rejected for any reason) because those ballots determine the winner of the election.
The vote counts for the Dem candidates in GA 2016 & 2020 are population-level counts. They represent all votes in the population of interest. Setting up a hypothesis test to determine whether the two vote counts are equal is completely nonsensical.
Asking if the two vote counts are equal is not a legitimate statistical question. Because we know the true population counts, we simply have to look at the two numbers (1,877,963 and 2,474,507). We see that they are not equal, and we conclude that with 100% certainty.
Assigning any positive probability, even a tiny value such as 1 in a quadrillion, to the possibility of the two observed counts being equal is giving the event infinitely more probability than it has. The probability the 2 counts are equal is 0 b/c we know the values aren't equal
“But Sam,” you’re saying, "I want to know where the 1 in a quadrillion value comes from!”
Ok, fine. I’ll tell you, but I want to be perfectly clear:
Ok, fine. I’ll tell you, but I want to be perfectly clear:
The methods that result in the values I’m about to show you have absolutely no legitimate statistical basis. No honest statistician would ever do these computations in this context.
STAT 101 refresher: The binomial distribution is a discrete probability distribution that is used to find the probability of a number of successes in a fixed number of independent trials where each has 2 outcomes (success, failure) & probability of success is equal in all trials
Voting meets only some of the requirements to use a binomial distribution. The independence assumption is violated (e.g. how u vote is not independent of how ur spouse votes), but since u usually go into the voting booth alone, I will grant it for generosity’s sake.
We can also construct the problem so that we define “success” as “vote for Dem.” and “failure” as “vote for not the Dem.,” so there are 2 outcomes. This isn’t really how elections are seen (there are more than 2 candidates), but I can grant this because of our 2 party system.
An assumption that I am totally not willing to grant is that all trials (here, voters) have the same probability of success. A 30-year Republican voter has a very small probability of voting for a Dem. candidate, while a 30-year Dem. voter has a very high probability.
The final assumption, that the # of trials is fixed, is also violated because the voting population is different every election.
(This is also why election polling is so hard: you're trying to sample a population [voters in the election] that doesn't exist yet.)
(This is also why election polling is so hard: you're trying to sample a population [voters in the election] that doesn't exist yet.)
Because the last 2 assumption are violated, the Binomial distribution does not apply here.
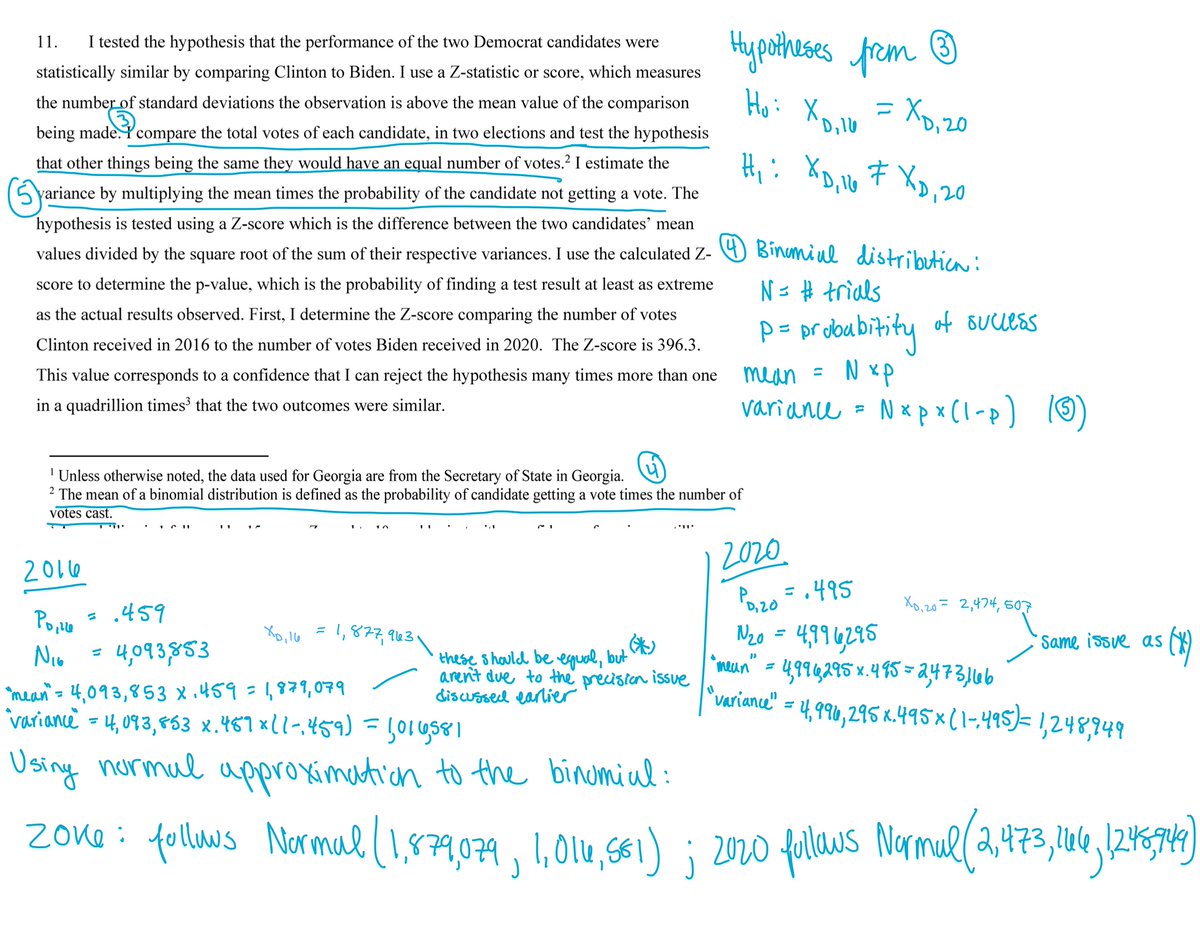
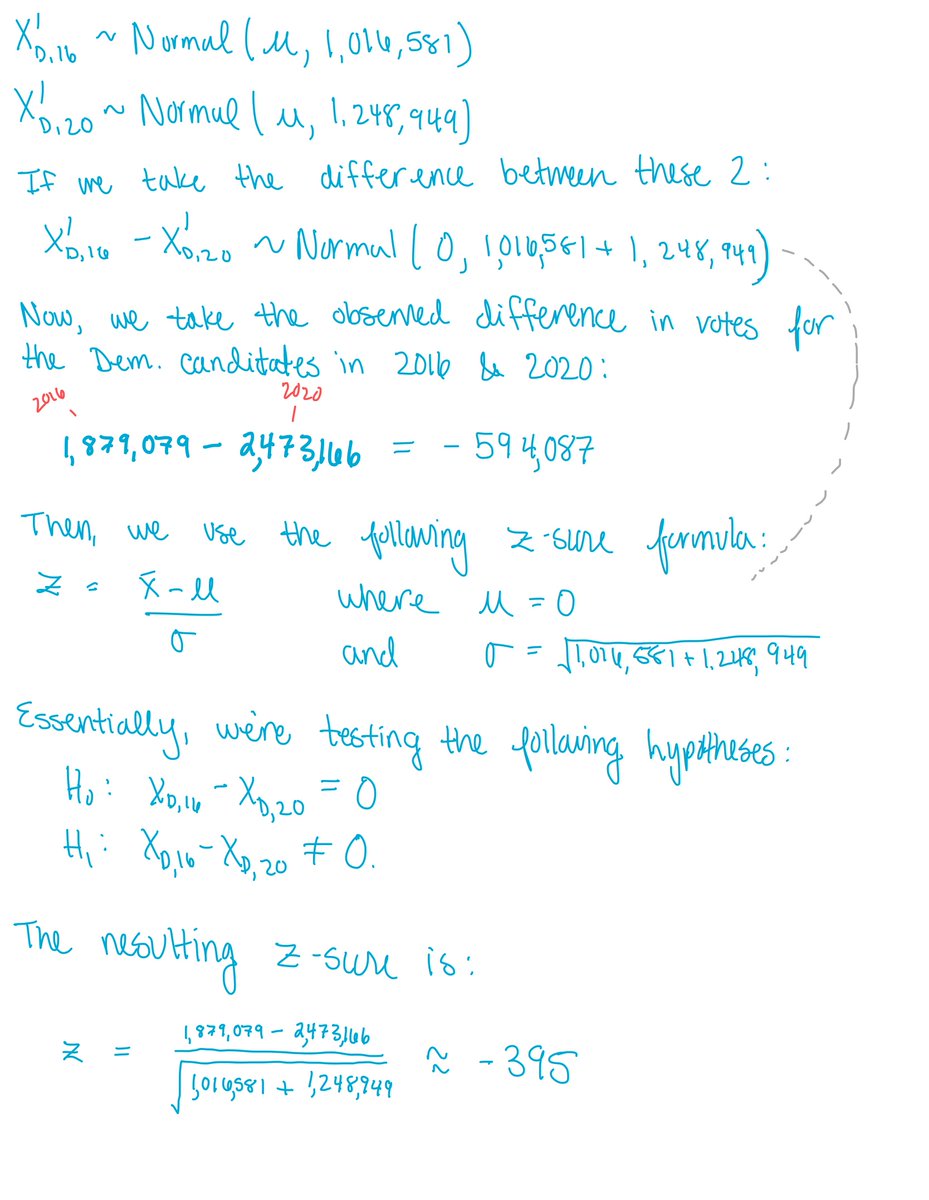
But that doesn’t stop the author from applying the binomial distribution to this problem. Again, this is totally wrong, but here’s the math:
But that doesn’t stop the author from applying the binomial distribution to this problem. Again, this is totally wrong, but here’s the math:
I also snuck the normal approximation to the binomial in there. https://en.wikipedia.org/wiki/Binomial_distribution#Normal_approximation
Next, we're going to treat the vote counts for the Dem. candidate in 2016 & 2020 as coming from 2 normal distributions with the SAME unknown mean, but different variances.
Next, we're going to treat the vote counts for the Dem. candidate in 2016 & 2020 as coming from 2 normal distributions with the SAME unknown mean, but different variances.
We then take the difference of those 2 variables to result in a normal distribution with mean 0 and variance equal to the sum of the 2 variances.
Then, all we do is a simple hypothesis test where the null hypothesis is that the true difference in vote counts is equal to 0.
Then, all we do is a simple hypothesis test where the null hypothesis is that the true difference in vote counts is equal to 0.
As you can see, we get a z-score of 395 which is just about equal to the z-score in the declaration, accounting for rounding errors.
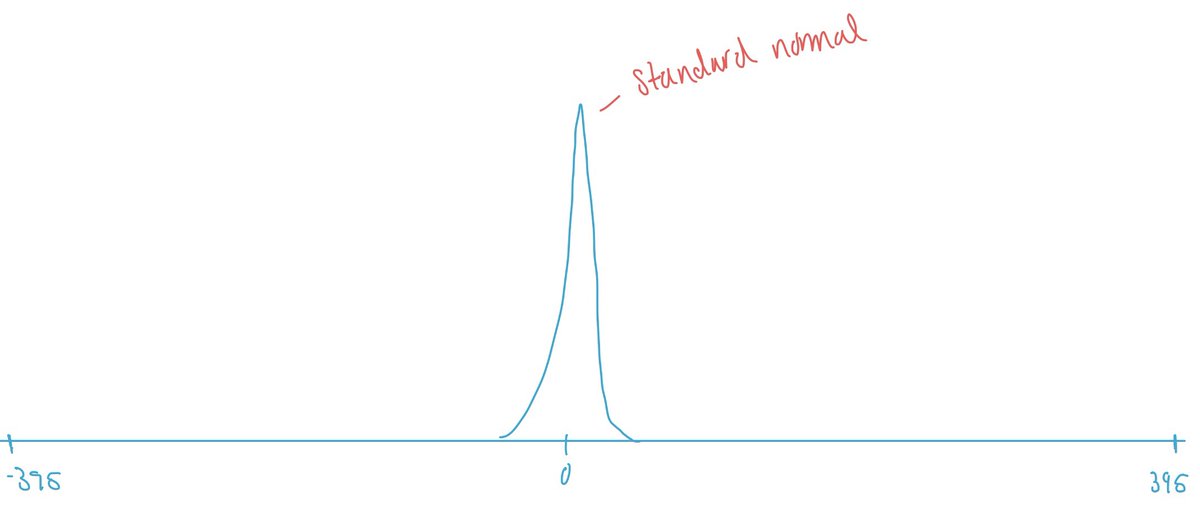
The p-value for this z-score is so small as to be essentially 0. It's more extreme than I could draw, and it's so extreme that every calculator I tried to use to calculate the exact p-value just gave me 0.
So, where did the the 1 in 1 quadrillion number come from?
So, where did the the 1 in 1 quadrillion number come from?
So where did the quadrillion number come from? Nowhere. The author just picked a number for the p-value (1 / 10^15) that sounded ridiculously small.
In reality, the "z-score" provided results in a "p-value" so small, it's even smaller than 1 in a googol and 1 in a centillion
In reality, the "z-score" provided results in a "p-value" so small, it's even smaller than 1 in a googol and 1 in a centillion
(Anyone can pick small sounding numbers https://en.wikipedia.org/wiki/Names_of_large_numbers)
What this really boils down to is a totally flagrant abuse of statistical methods that have no basis in sound statistical theory.
What this really boils down to is a totally flagrant abuse of statistical methods that have no basis in sound statistical theory.
The author just massaged the numbers and plugged them into different formulae until a sufficiently tiny number fell out.
I had originally planned on looking at all 10 pages of this declaration, not just 1.
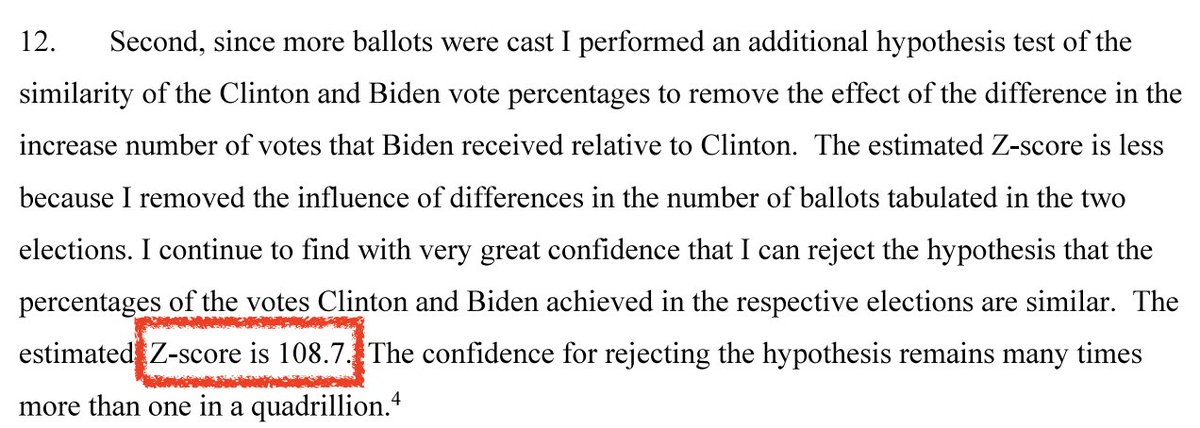
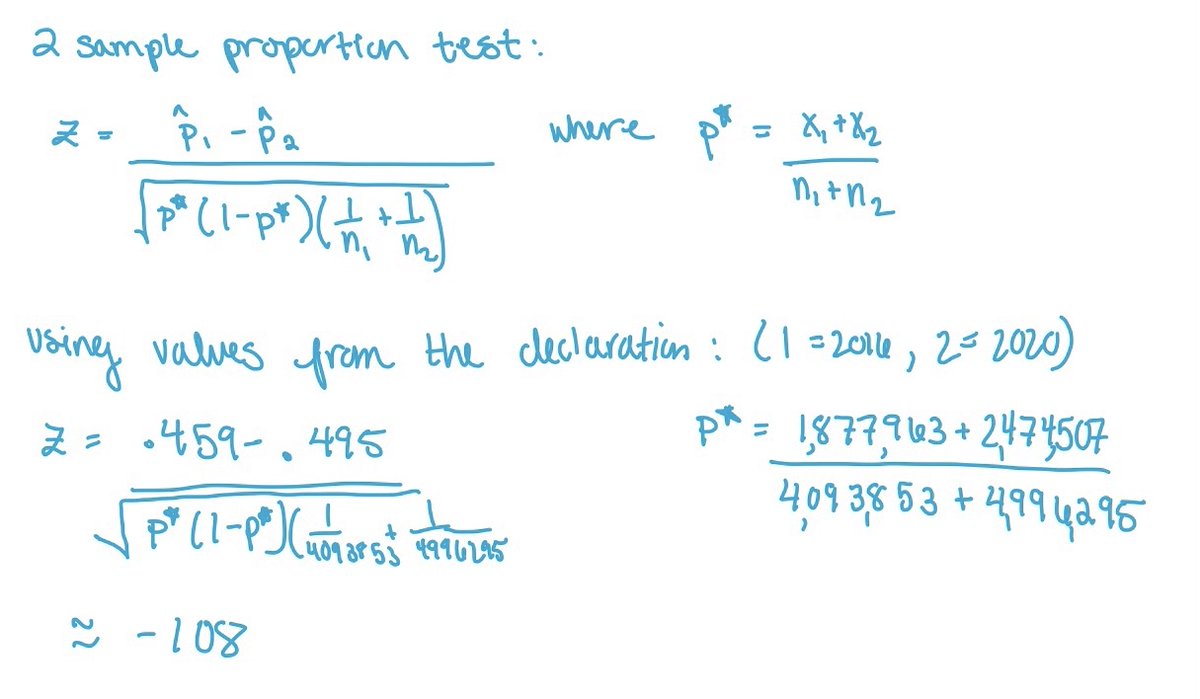
Consider paragraph 12, where another z-score pops up
Consider paragraph 12, where another z-score pops up
The author got that number by abusing the z-score calculation for a 2-sample proportion test: https://online.stat.psu.edu/stat800/lesson/5/5.5
That's all I can do for now. I'm going to take a break from thinking about this. It's too disheartening.
In 3 paragraphs, the author performed so many abuses and misuses of statistics, that I'm convinced that at this point, I've put in at least the same amount of work to write this thread as the author did to prepare a declaration to be submitted to the highest court of the land.
This is so terribly disappointing, and I feel embarrassed to call myself a statistician when people abuse our profession like this.
When people talk about "lies, damned lies, and statistics," they're never talking about statisticians. They're talking about jerks like this. /fin
When people talk about "lies, damned lies, and statistics," they're never talking about statisticians. They're talking about jerks like this. /fin

 Read on Twitter