REVEALED! There's a reason why so many officials in California are caught off guard trying to respond to a simple question: "What was the ICU capacity around this same time last year?"
They fear... embarrassment!
We just uncovered details which they tried to delete.
1/
They fear... embarrassment!
We just uncovered details which they tried to delete.
1/
Los Angeles County and the Hospital Association created a pandemic plan back in 2009. They got rid of the document recently but the internet is forever.
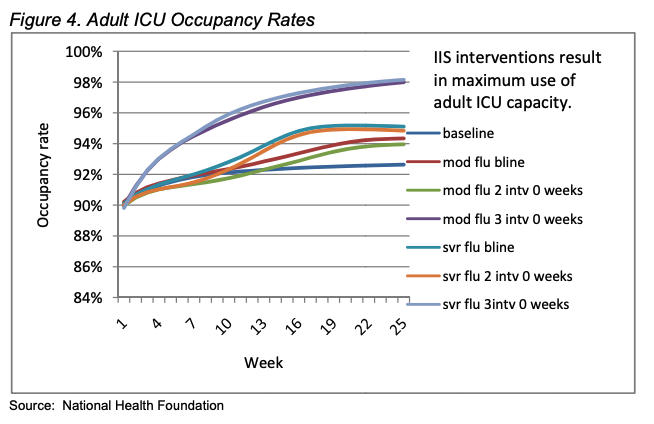
Key chart: ICUs OPERATE ABOVE 90% EVERY SEASON!
2/
Key chart: ICUs OPERATE ABOVE 90% EVERY SEASON!
2/
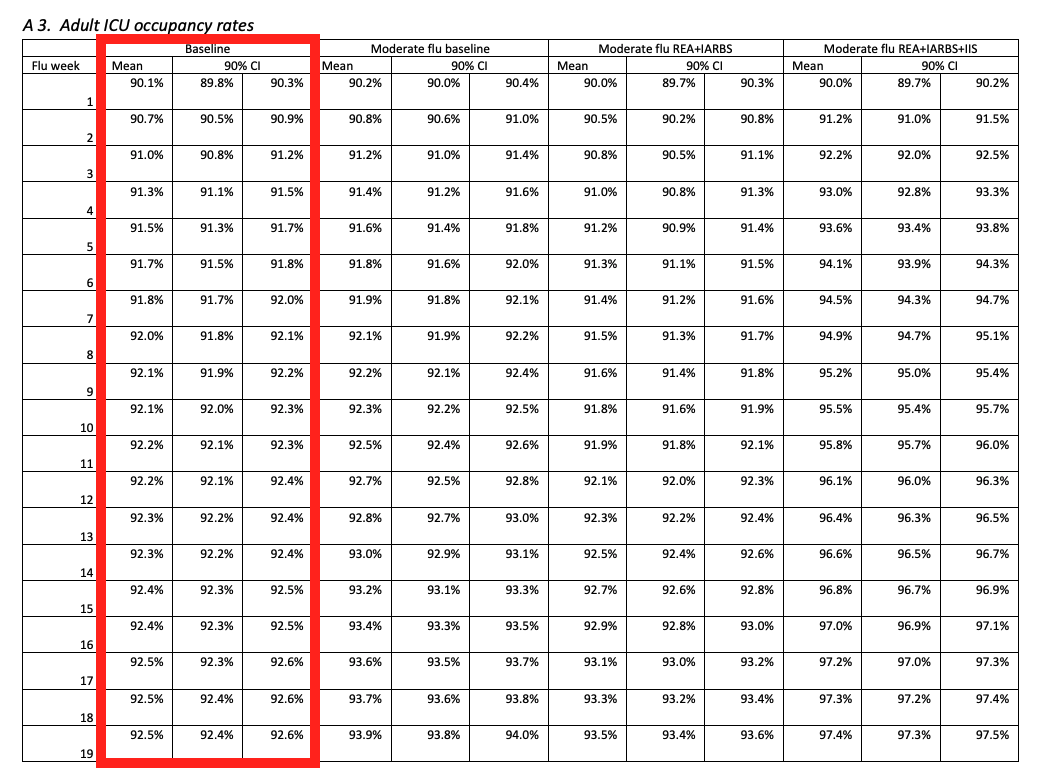
Even the appendix with its lengthy array of admission numbers shows us that we're not even close to emergency room admission during the worst pandemic projections.
3/
3/
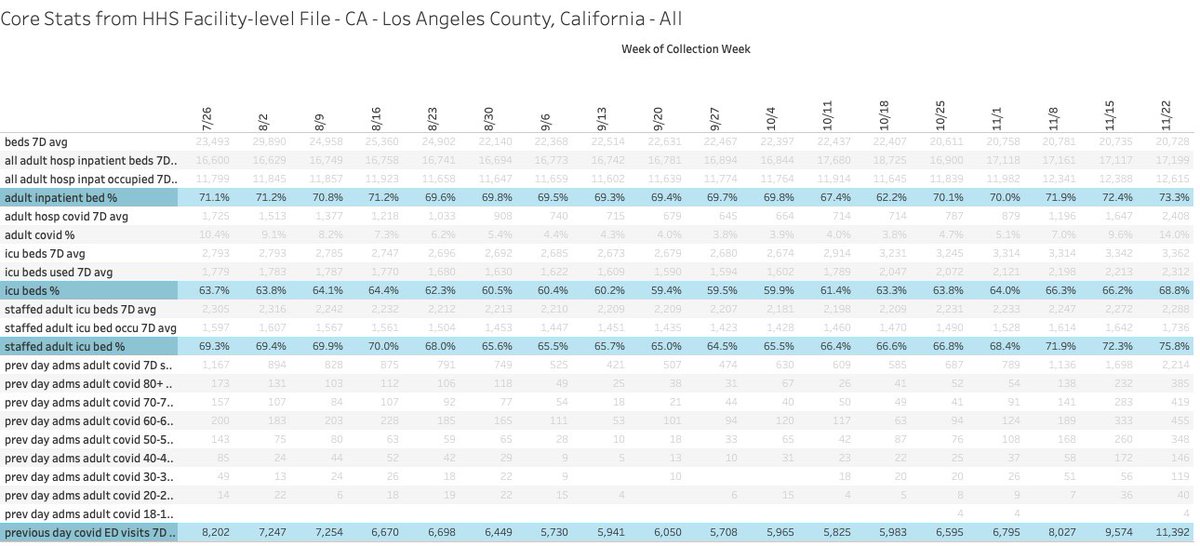
Compare that to ALL hospitals in L.A. over the past several months... even nearing our biggest bursts here in Q4.
- % inpatients lower
- % ICUs lower
- ER admissions lower
I'm all for a buffer zone and many counties are pulling all elective surgeries
BUT...
4/
- % inpatients lower
- % ICUs lower
- ER admissions lower
I'm all for a buffer zone and many counties are pulling all elective surgeries
BUT...
4/
But the pandemic planning doc: "The reduce elective admissions (REA) intervention only results in occupancy rate decreases of approximately 0.5%..."
Even their own planning documents say that the interventions we're using are BOGUS!
Hey reporters - start asking questions!
Even their own planning documents say that the interventions we're using are BOGUS!
Hey reporters - start asking questions!
Original (deleted): https://hasc.org/sites/main/files/file-attachments/la_county_pandemi_flu_hspmfr.pdf?1324076761
Archive: https://web.archive.org/web/20201207042830/https://www.hasc.org/sites/main/files/file-attachments/la_county_pandemi_flu_hspmfr.pdf?1324076761
Interactive tool from @Rational_Ground https://rationalground.com/data/hospital-data-facility-level/
Archive: https://web.archive.org/web/20201207042830/https://www.hasc.org/sites/main/files/file-attachments/la_county_pandemi_flu_hspmfr.pdf?1324076761
Interactive tool from @Rational_Ground https://rationalground.com/data/hospital-data-facility-level/

 Read on Twitter


