1. It’s #researchmethodologies time! This week we’re beginning descriptive statistics (DS), specifically, measures of central tendency (MOCT)
Are you clear on what descriptive statistics are?
Are you clear on what descriptive statistics are?
3. What are descriptive statistics used for?
They are used to quantitatively summarise data/features from a sample so that the sample can easily be understood.
They tell us if the sample is normally distributed.
Determine if the sample can be compared to the larger population.
They are used to quantitatively summarise data/features from a sample so that the sample can easily be understood.
They tell us if the sample is normally distributed.
Determine if the sample can be compared to the larger population.
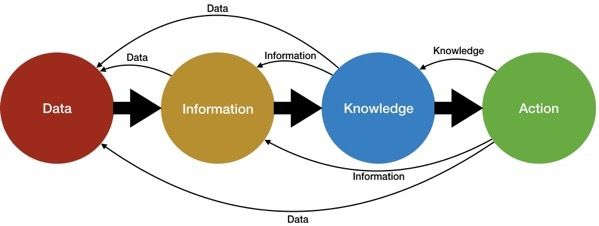
Use of DS is a simple way to convert data into information. This may be all a simple study needs but DS often form the initial description of data as part of a more extensive statistical analysis.
5. Compared to inferential statistics
DS just summarises whereas inferential stats use the data to learning about the population that the sample represents. Where inferential stats are presented, DS are typically presented along with it (eg) sample sizes, demographics.
DS just summarises whereas inferential stats use the data to learning about the population that the sample represents. Where inferential stats are presented, DS are typically presented along with it (eg) sample sizes, demographics.
The summaries of data in DS can be presented as quantitative, numerical descriptions or graphical, visual descriptions.
7. Individual observations within a sample or population tend to cluster about a central location, with more extreme observations being less frequent. Central tendency is the idea that there is one number that best summarises the entire data set.
The extent to which observations cluster can be described by the central tendency whereas the spread of data can be described by the degree of dispersion descriptors. Today we will discuss measurement of central tendency (MOCT): the mean, the median, and the mode.
Mean: There are three types of mean: arithmetic, geometric and harmonic. It is the arithmetic mean that we are most familiar with in medical literature, and it is also known as the average. Disadvantages: It is sensitive to extreme values.
If 10 people go out for dinner and the meal ends up costing €200, the average price of the meal is 200/10 = 20. But what if 9 of those people had pasta costing €15 and 1 person treated themselves to lobster thermidor costing €65? The lobster has inflated our MOCT.
What if we use median? Median = the number which divides the data into 2 equal parts. If the number of variables is odd, the median is the middle number (aka the 50th percentile). If the number of variables is even, we average the middle two terms.
Back to our 10 diners:
€15+€15+€15+€15+€15+€15+€15+€15+€15+€65
Median=average of 2 middle numbers=€15
Better representation of the individual scores (ie) better summary of the central tendency of the data, as it more closely resembles the majority of the scores
€15+€15+€15+€15+€15+€15+€15+€15+€15+€65
Median=average of 2 middle numbers=€15
Better representation of the individual scores (ie) better summary of the central tendency of the data, as it more closely resembles the majority of the scores
So where data sets contain extremes, the median is a more sensible MOCT. House prices are typically reported as medians specifically because it’s less sensitive to the effect of the price of the €5,000,000 mansion, or the €30,000 ruin in the area.
A compromise between the mean and the median is the trimmed mean, where the top and bottom 5 or 10% of scores are removed and the remaining data points are averaged. This protects against distorsion by outliers while taking into account more of the scores than the median.
Finally, mode is the most commonly occurring score.
€15+€15+€15+€15+€15+€15+€15+€15+€15+€65
Mode=€15
If no number repeated, mode=No Mode
Possible to have more than one mode.
Mode is the only MOCT that can be used for categorical data (eg) gender
€15+€15+€15+€15+€15+€15+€15+€15+€15+€65
Mode=€15
If no number repeated, mode=No Mode
Possible to have more than one mode.
Mode is the only MOCT that can be used for categorical data (eg) gender
That concludes our #researchmethodologies #tweetorial for this week. More on descriptive statistics in my next tweetorial. Thanks for reading! #criticalcare #intensivecare #MedEd #foam #FOAMed #medtwitter #medstudenttwitter #galway #saolta
@DrAoifeBee
@DrAoifeBee

 Read on Twitter


