OK, on to the data thread. New cases were about a day older than usual today. In contrast, newly added hospitalizations were more recent. Deaths skewed older today - 43% of newly reported deaths were over two weeks old...
Currently hospitalized was down 87 day over day (-1.7%) to 5,108. That compares to the fall uptrend Thursday average of +1.8%, median of +1.7%, and last week’s -1.5%%. D/D growth has been below average the last 11 days
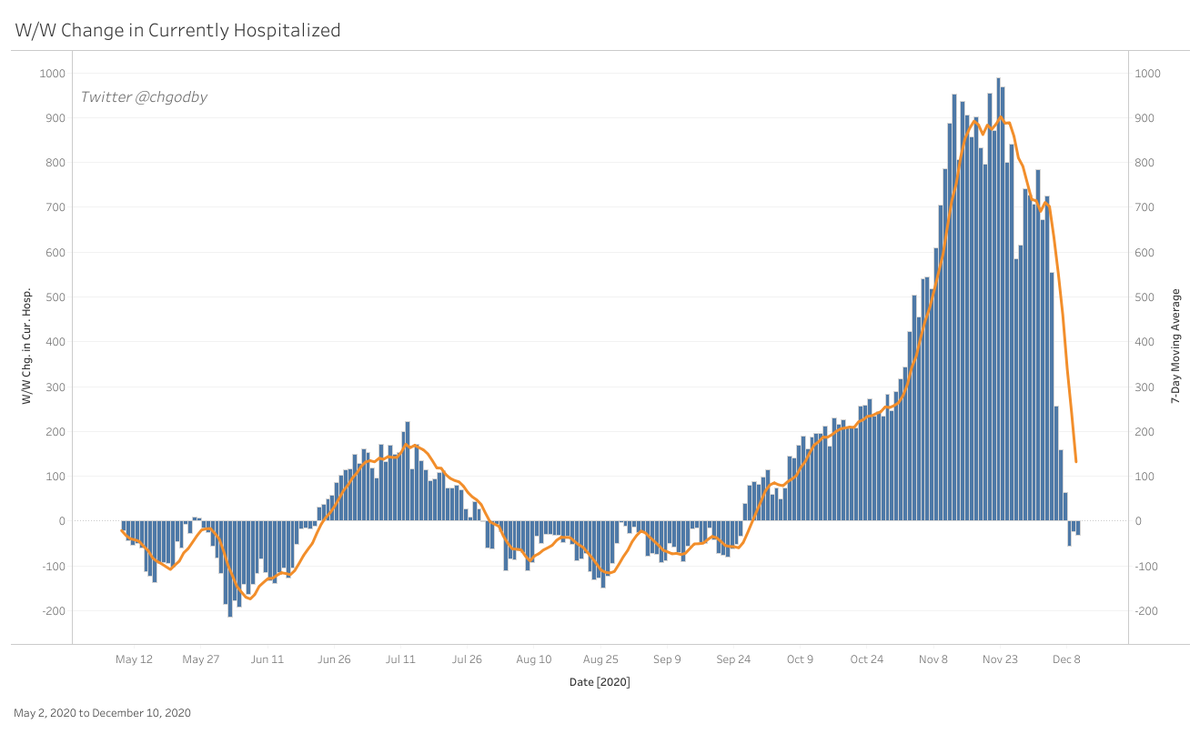
Currently hospitalized was down 31 week over week, marking our third straight day with a week over week decline. That compares to the 7-day MA of +132 and yesterday at -24.
Same chart but on a percentage basis. Currently hospitalized was down 0.6% W/W. That compares to the 7-day MA of +2.9% and yesterday at -0.6%
This chart shows 7-day MA new modeled hosps (orange) & modeled discharges+deaths (red). Notice that the orange line crossed the red line a few days ago, indicating that 7-day MA discharges+deaths are outnumbering new admits. We want to see the new hosp line continue to fall
So the Q everyone’s thinking – am I seeing clear signs of a Thanksgiving surge in the currently hospitalized data? The short answer is no. We’ve had 11 straight days of below average day over day growth & W/W % hosp growth continues to follow the since peak trendline…
We got as expected increases on Monday & Tuesday this week (lower discharge days), but they were much smaller than usual. Today’s day over day decline was as good or a little better than I expected. There’s just no red flag (yet) screaming Thanksgiving surge
If I’m picking nits, one could argue that the rate of new modeled hospitalization declines appear to have slowed recently…
Also, W/W % declines have fallen below zero the last three days, but the rate of decline has hit a three day plateau. One could argue that maybe Thanksgiving has slowed our rate of decline…
But frankly, it just looks like noise to me. W/W currently hospitalized growth was dropping well below trend from 12/5 to 12/9 & now we’re coming back to the trendline
Net/net, what I’m seeing right now appears indicative of the December Peak scenario I laid out a few days ago and have talked about for the past week. We’re not out of the woods though. Secondary infections from T-Day would just now be hitting hospitals… https://twitter.com/chgodby/status/1336093218132340736?s=20
If primary infections from Thanksgiving caused new hosps to flatten, secondary infections could cause currently hospitalized to move higher again
That’s what I have for today! I continue to like what I’m seeing from the currently hospitalized data & I don’t see a red flag screaming Thanksgiving surge.
***Knocks on wood***
Let’s continue to hope for the best, but prepare for the worst
***Knocks on wood***
Let’s continue to hope for the best, but prepare for the worst

 Read on Twitter


