1/ As 2020 is coming to a close, I wanted to share some of my favorite graphs / pictures I collected throughout the year.
2/ March was one of the fastest sell-offs in history.
3/ The world came to a stop.
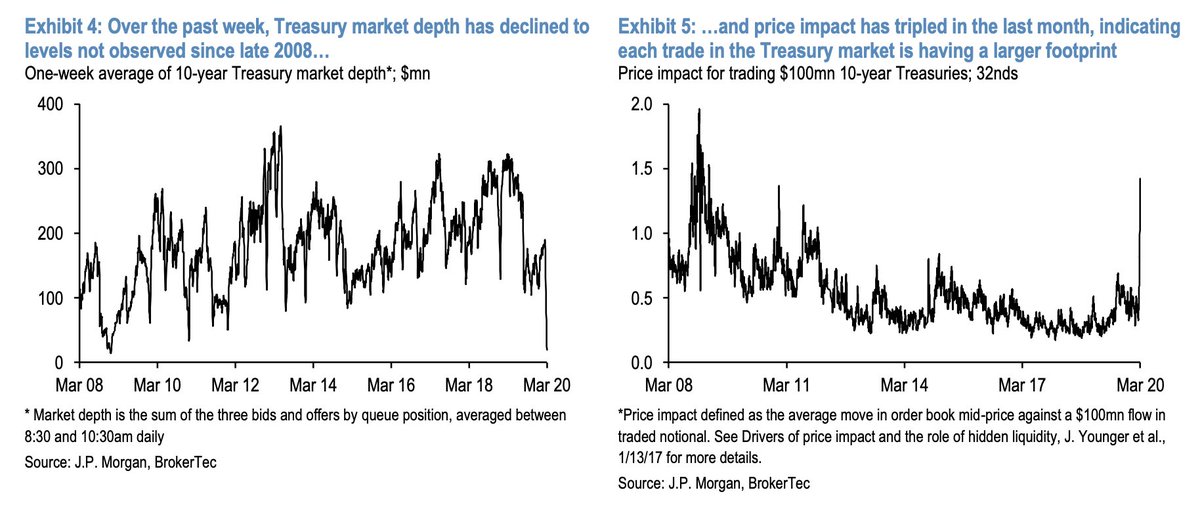
4/ Treasury market depth plunged.
5/ Treasury volatility hit extremes.
6/ Stock/bond correlations broke down
7/ "Gallows humor" by yours truly
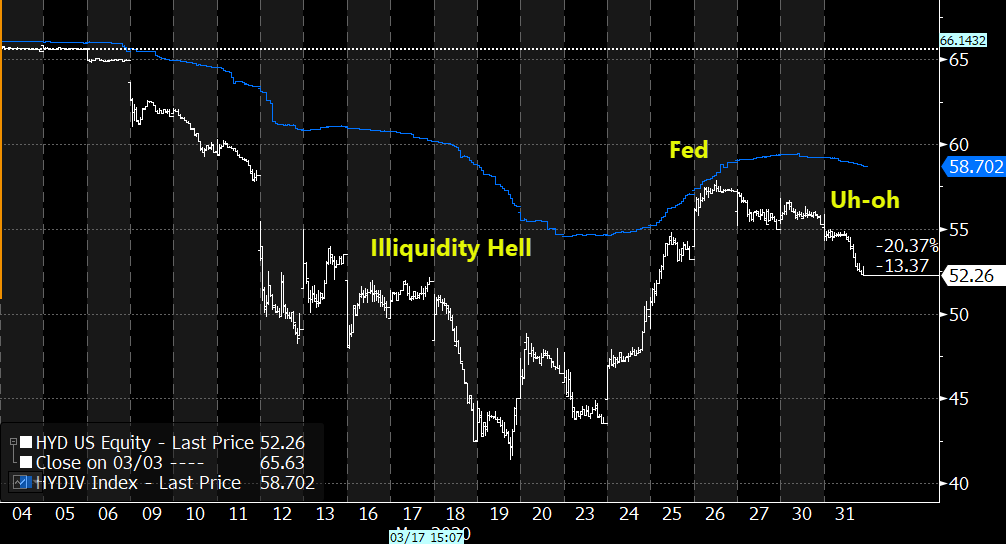
8/ Corporate bond ETFs ($LQD) fell 20% in 2 weeks while IG saw some of the largest outflows ever.
9/ Bond ETF prices meaningfully diverged from NAV.
10/ So much so that there might be some interesting optionality embedded in holding bond mutual funds?

(h/t @EconomPic)
11/ People mistook $ZOOM for $ZM.
12/ The SEC had something to say about it.
13/ Variance Swaps blew up.
14/ The intraday / overnight conundrum continues.
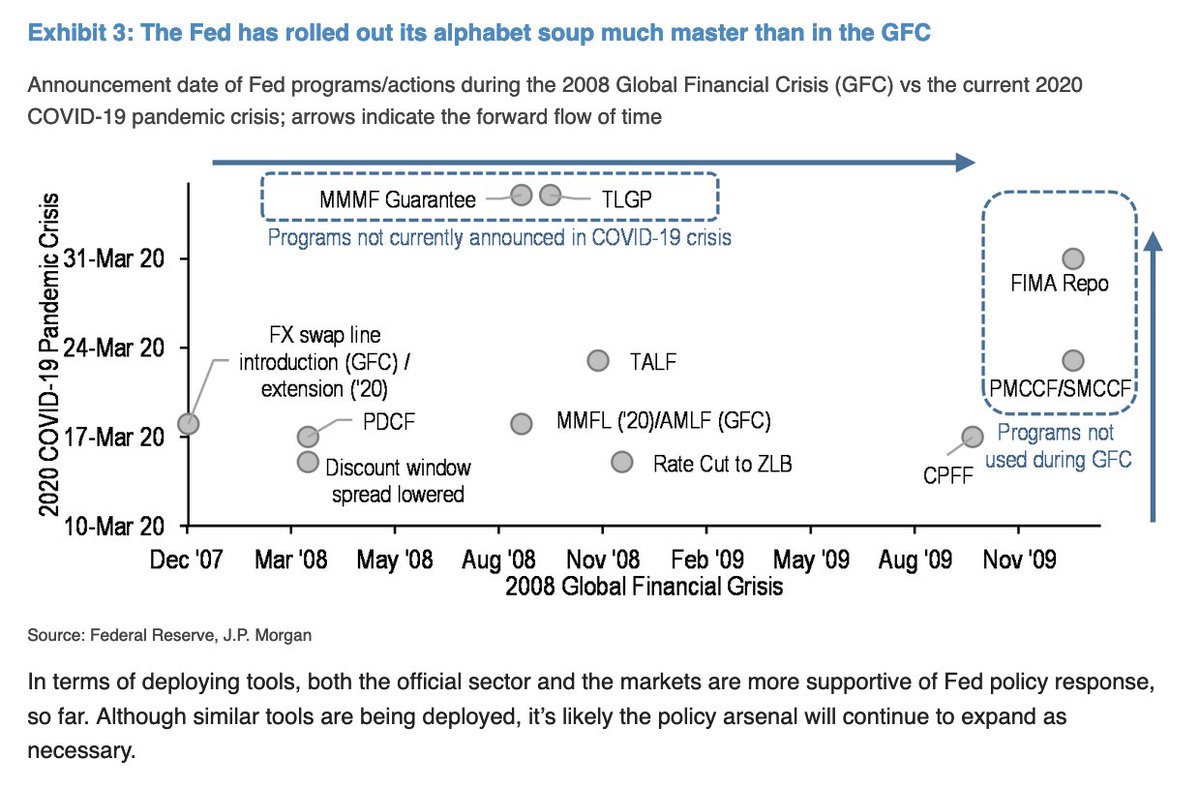
15/ The Fed unrolls the entire 2007-2009 playbook in just a few weeks.
16/ And they start buying bond ETFs.

(Okay, not technically, but whatever.)
17/ IG and HY issuance 🚀
18/ Factor correlations move to extremes.

(h/t @wjruss84)
19/ Factor vol starts getting extreme
20/ Momentum had a -16.4σ move

(Yes, yes, I know, fat tails, yada yada)
21/ The liquidity / VIX dynamic post Feb 2018

(h/t @FadingRallies)
22/ The "call option casino"
23/ Okay, folks, what did I miss? Add below! 👇
24/ Can’t believe I missed this one...
25/ HODLers rejoice!
26/ Can’t not mention $TSLA’s meteoric rise here!

(Equity issuance suggests Elon’s not one to look a gift horse in the mouth)
You can follow @choffstein.
Tip: mention @twtextapp on a Twitter thread with the keyword “unroll” to get a link to it.

Latest Threads Unrolled:

By continuing to use the site, you are consenting to the use of cookies as explained in our Cookie Policy to improve your experience.