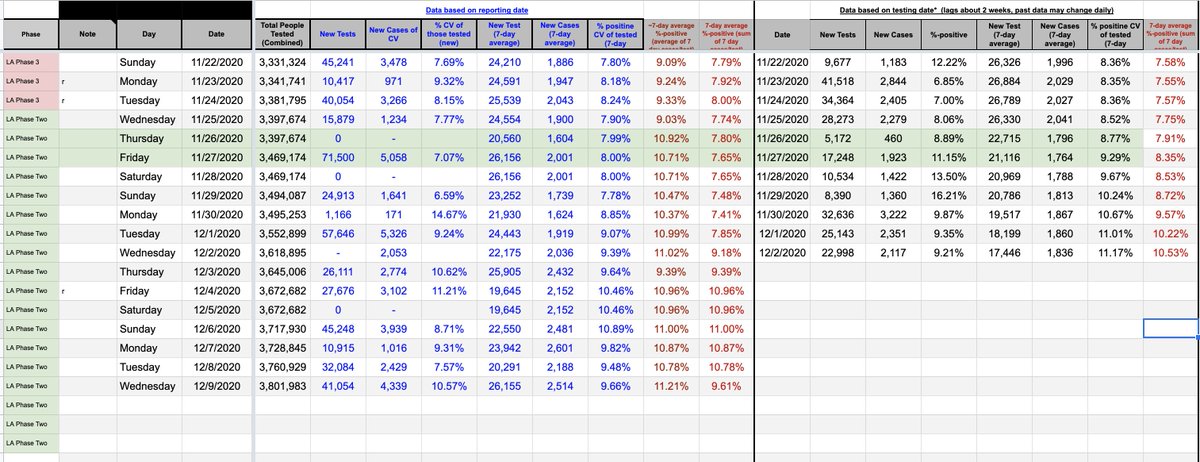
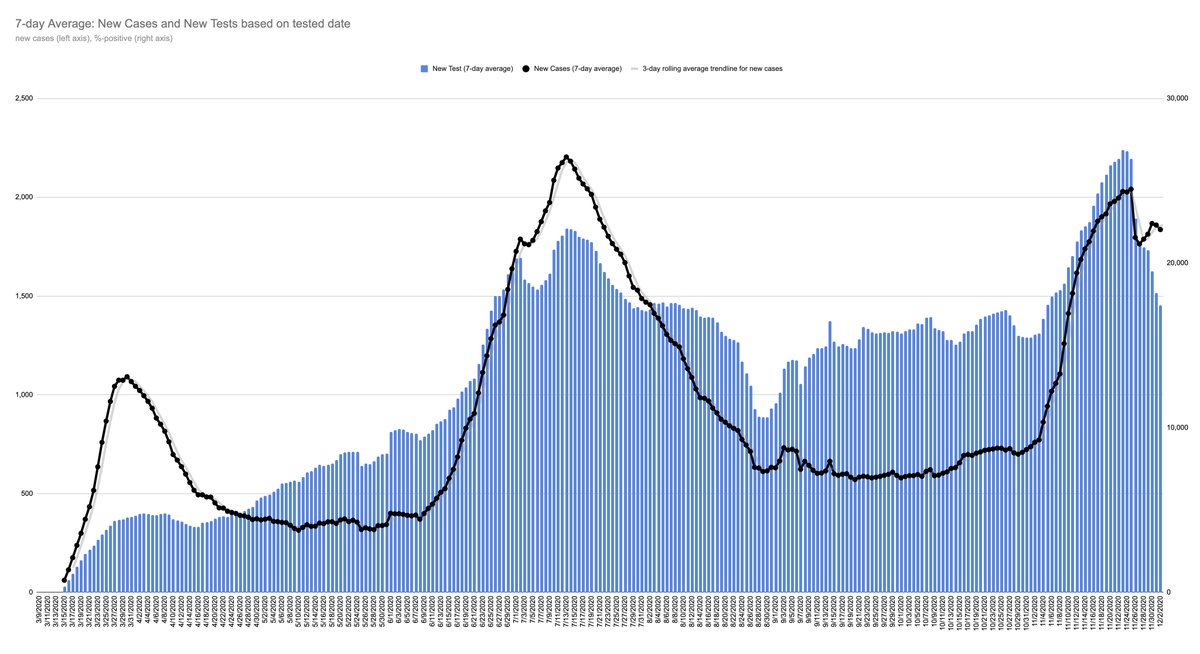
The following set of graphs/charts were derived using the *date of test* data by LDH updated weekly on Wednesday.
 most important - Louisiana is at a 7-day percent positive of 11.17% and we've been above 10% since the beginning of the month
data only goes back to 12/2
 most important - Louisiana is at a 7-day percent positive of 11.17% and we've been above 10% since the beginning of the month
 data only goes back to 12/2

 Read on Twitter


