Another mega-thread of ethnic maps today, looking at various Asian groups.
Chinese Americans make up 1.3% of the population and are prevalent in most urban areas, and especially California. San Francisco (21.3%) has the highest proportion of Chinese-Americans in the country.
Chinese Americans make up 1.3% of the population and are prevalent in most urban areas, and especially California. San Francisco (21.3%) has the highest proportion of Chinese-Americans in the country.
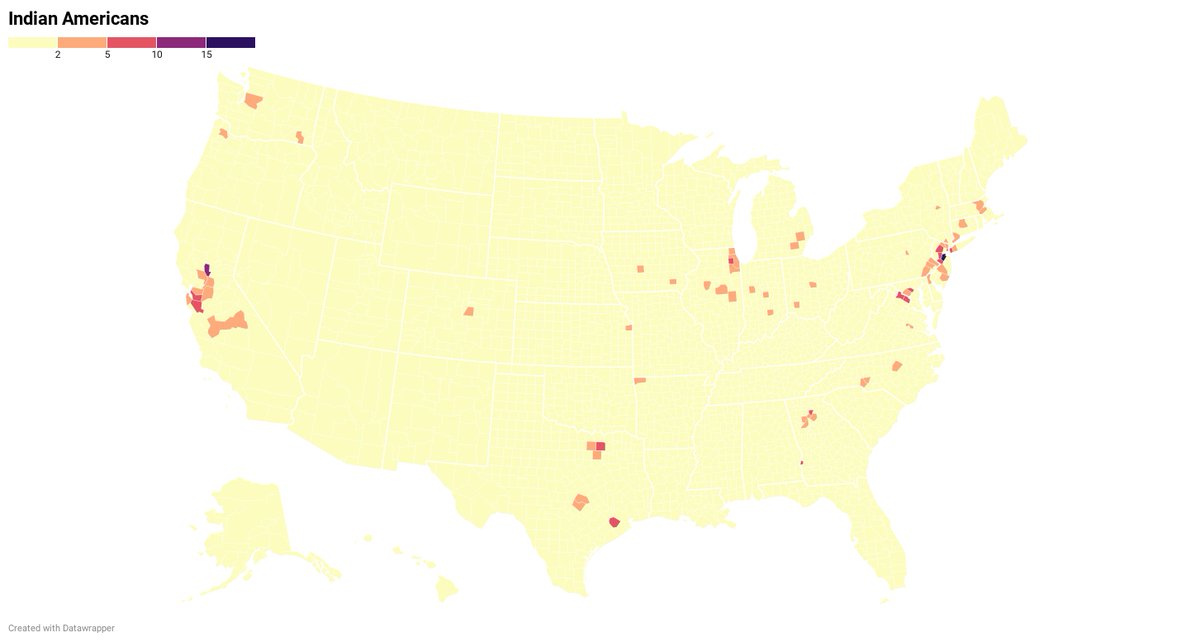
Already posted this one, but here's Indian-Americans. They make up 1.2% of the population, and Middlesex County in NJ (15.3%) has the highest proportion of Indian-Americans in the country.
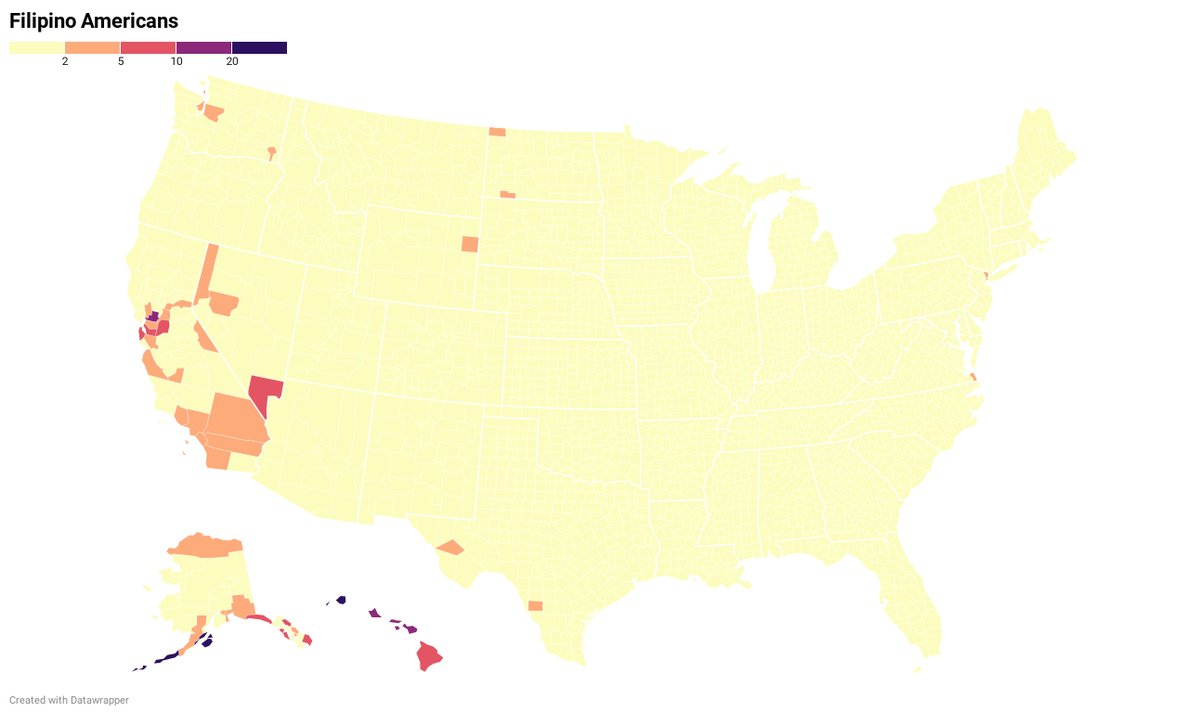
Filipino Americans make up 0.9% of the population, and are prevalent in Alaska, California, and Hawaii. Aleutians West (34.9%) has the highest proportion of Filipino Americans in the country.
Vietnamese Americans make up 0.6% of the population, and are prevalent along the West and Gulf Coasts. Santa Clara and Orange Counties have the highest proportion of Vietnamese Americans in the country.
Korean Americans make up 0.5% of the population, and are prevalent in California, the DC area, and Jersey. Bergen County (6.2%) has the highest proportion of Korean Americans in the country.
Japanese Americans make up .2% of the population, and are prevalent in Hawaii and California. Honolulu County (14%) has the highest proportion of Japanese Americans in the country.
'Other Asian' Americans (0.8%) include groups like the Hmong of Minnesota, Pakistanis, and more. Ramsey County (10.7%) has the highest proportion of these groups in the country.
Not counted as Asian Americans, but here's Armenian Americans. The Armenian communities in Glendale, Fresno, and Massachusetts stand out.
#ElectionTwitter #maps
@SenhorRaposa @xxxneonslavexxx @AmyTheSnowWoman @DanDHNguyen01 @lxeagle17 @JMilesColeman
@SenhorRaposa @xxxneonslavexxx @AmyTheSnowWoman @DanDHNguyen01 @lxeagle17 @JMilesColeman

 Read on Twitter


