Here is a short thread of crazy facts I learned about the history of the American economy while writing this story: https://www.theatlantic.com/science/archive/2020/12/new-visual-history-american-energy/617329/
In 1800, fossil fuels played no role in the economy. But Americans burned so much firewood, so inefficiently, that US per capita energy use was about 1/3 of its 2019 level.
Think of all the gasoline, jet fuel, electricity we use today. They got to a third of that with firewood!
Think of all the gasoline, jet fuel, electricity we use today. They got to a third of that with firewood!
The arrival of railroads transformed US transportation—specifically, it transformed horses.
Trains make it possible to run industrial-scale selective-breeding programs for large animals. So…
Trains make it possible to run industrial-scale selective-breeding programs for large animals. So…
From 1800 to 1900, horse bodies undergo a “massive expansion,” becoming 50% more powerful.
Horses go from eating ~25,000 calories/day to as much as 40,000. https://www.theatlantic.com/science/archive/2020/12/new-visual-history-american-energy/617329/
Horses go from eating ~25,000 calories/day to as much as 40,000. https://www.theatlantic.com/science/archive/2020/12/new-visual-history-american-energy/617329/
Industrialization is a looong process and it happens mostly at home.
The first anthracite coal mine (run by settlers) opens in 1775 in Pennsylvania.
But only in 1888 does coal generate as much energy per capita as *firewood and animal feed combined.* https://www.theatlantic.com/science/archive/2020/12/new-visual-history-american-energy/617329/
The first anthracite coal mine (run by settlers) opens in 1775 in Pennsylvania.
But only in 1888 does coal generate as much energy per capita as *firewood and animal feed combined.* https://www.theatlantic.com/science/archive/2020/12/new-visual-history-american-energy/617329/
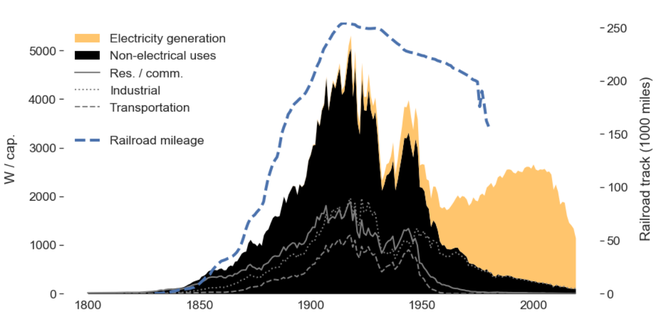
Coal has been dying for more than a century. At its peak in 1918, coal powered nearly every part of the economy.
Then it foundered, priced out by gas and oil. Only after the 1970s oil crisis did it find a new niche in power generation. https://www.theatlantic.com/science/archive/2020/12/new-visual-history-american-energy/617329/
Then it foundered, priced out by gas and oil. Only after the 1970s oil crisis did it find a new niche in power generation. https://www.theatlantic.com/science/archive/2020/12/new-visual-history-american-energy/617329/
But coal’s death took a long time. Not until 1959 do Americans use more electrical energy than coal power at home and in stores and offices.
(Another way of saying this, I think, is that coal is a phenomenally inefficient form of energy.) https://www.theatlantic.com/science/archive/2020/12/new-visual-history-american-energy/617329/
(Another way of saying this, I think, is that coal is a phenomenally inefficient form of energy.) https://www.theatlantic.com/science/archive/2020/12/new-visual-history-american-energy/617329/
Americans’ energy use per capita actually peaks in 1973, on the eve of the first oil crisis.
The mid-70s… yes… just as real incomes were stagnating… and when inequality started rising… weird, I wonder if the economy changing structurally then

 https://www.theatlantic.com/science/archive/2020/12/new-visual-history-american-energy/617329/
The mid-70s… yes… just as real incomes were stagnating… and when inequality started rising… weird, I wonder if the economy changing structurally then


 https://www.theatlantic.com/science/archive/2020/12/new-visual-history-american-energy/617329/
While many energy sources have waxed and waned from 1800 to 2019 in *per capita* terms, the use of almost no energy source has decreased on net.
In fact, in US history, only one energy source has seen an absolute decline…
Coal. It’s the black part here:
https://www.theatlantic.com/science/archive/2020/12/new-visual-history-american-energy/617329/
In fact, in US history, only one energy source has seen an absolute decline…
Coal. It’s the black part here:
https://www.theatlantic.com/science/archive/2020/12/new-visual-history-american-energy/617329/
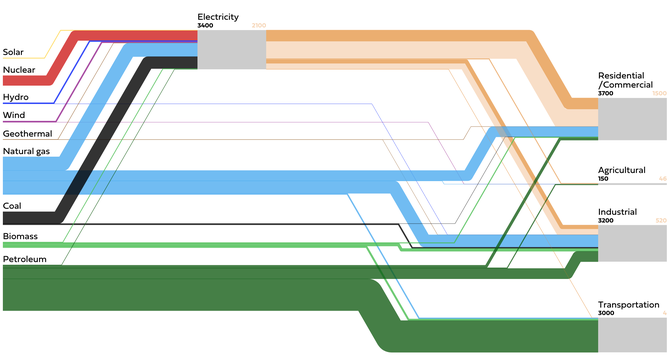
Solar & wind are growing fast. But rates≠levels.
Look at renewables in the 2019 US energy mix. They’re still like MS Paint mistakes! “We have to turn those pencil lines into boxes,” @emilygrubert told me. “The stuff we talk about wanting to do isn’t even visible on this chart.”
Look at renewables in the 2019 US energy mix. They’re still like MS Paint mistakes! “We have to turn those pencil lines into boxes,” @emilygrubert told me. “The stuff we talk about wanting to do isn’t even visible on this chart.”
This concludes my thread, which turned out not to be as short as I’d hoped. Read my story here: https://www.theatlantic.com/science/archive/2020/12/new-visual-history-american-energy/617329/
Or if you’re tired of my narration, play around with @RDCEPorg’s animated tool itself. It’s worth your time: https://us-sankey.rcc.uchicago.edu https://twitter.com/RDCEPorg/status/1336448997117087744
Or if you’re tired of my narration, play around with @RDCEPorg’s animated tool itself. It’s worth your time: https://us-sankey.rcc.uchicago.edu https://twitter.com/RDCEPorg/status/1336448997117087744

 Read on Twitter


