among all the rain dance efficacy claims about masks and lockdown and demands to "do something" one glaring fact remains about covid-19: it is primarily a regional and seasonal virus pattern.
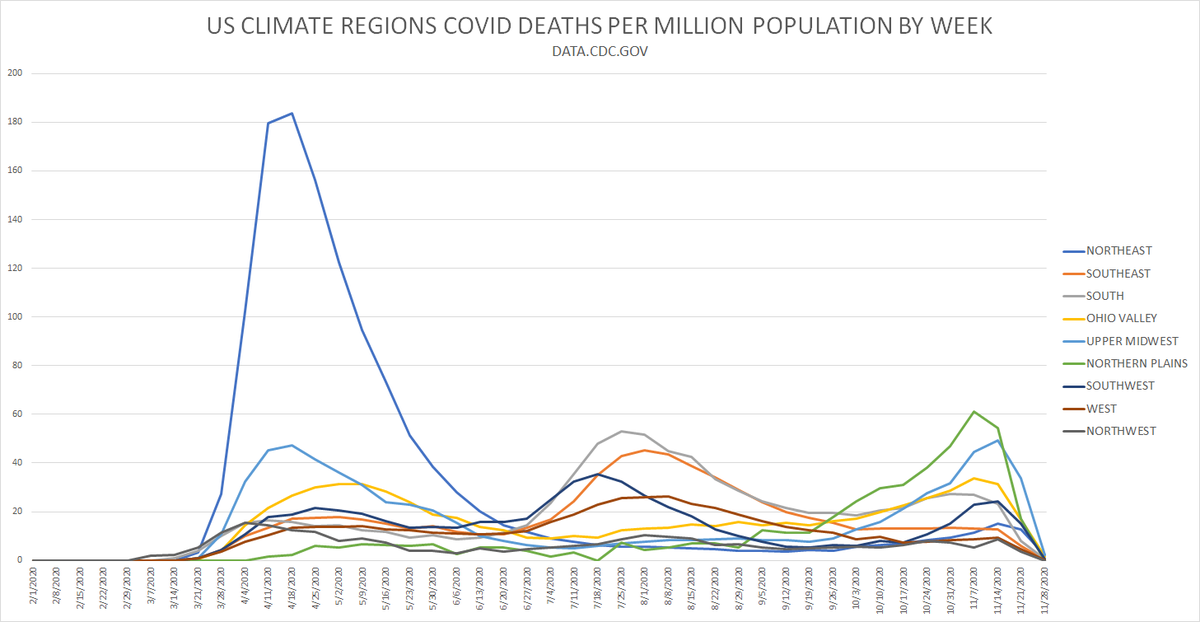
it's tempting to see the US as 3 waves, but this does not really look to be the case.
it's tempting to see the US as 3 waves, but this does not really look to be the case.
what appears to be the case is that this is mostly just regions taking place at different times.
i broke the US into climate regions and aggregated deaths by region using the CDC deaths data because it is best standardized and uses actual date of death
it lags some. (red above)
i broke the US into climate regions and aggregated deaths by region using the CDC deaths data because it is best standardized and uses actual date of death
it lags some. (red above)
so we should treat the last couple weeks as incomplete.
but the season pattern from these regions emerges clearly in the data.
this is not 3 waves in all locations, it's waves in multiple surges in different places being aggregated into a graph that looks like none of them.
but the season pattern from these regions emerges clearly in the data.
this is not 3 waves in all locations, it's waves in multiple surges in different places being aggregated into a graph that looks like none of them.
i made one change to the ontology. idaho is northern plains, not coastal NW. as most population in OR, WA is coastal, this seemed to make sense.
apart from that, i just used the US gov climate map.
several patterns emerge:
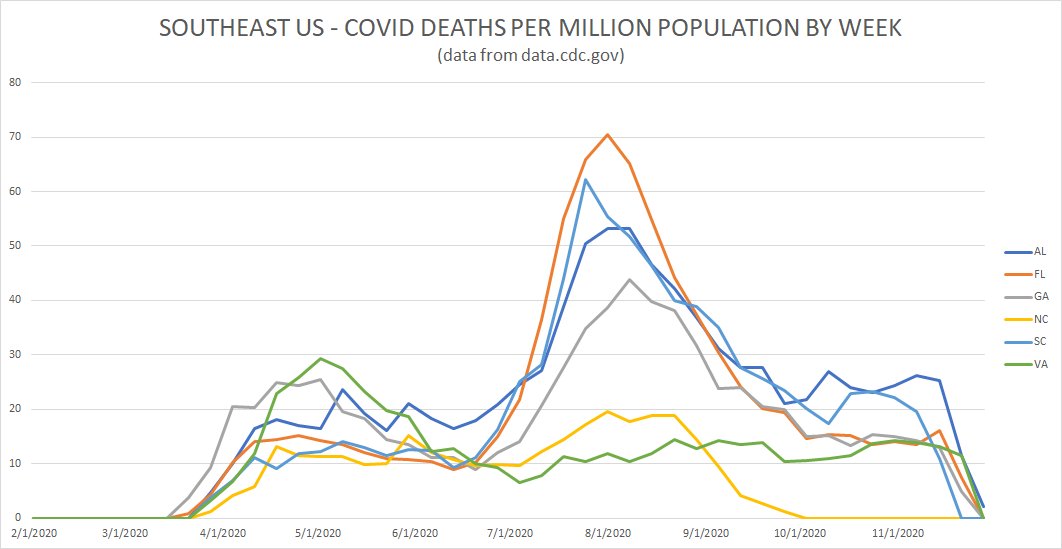
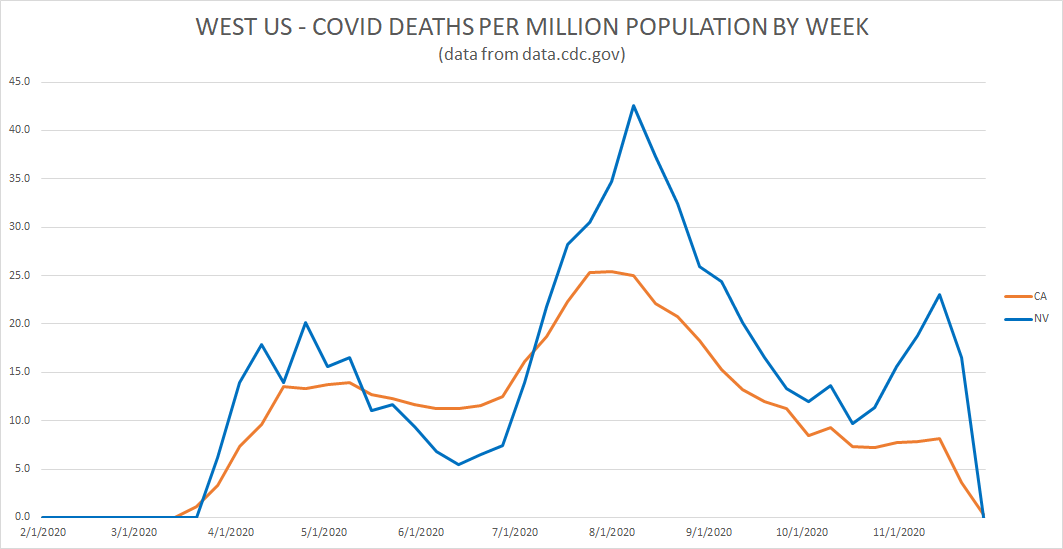
1. consistency was very high within regions.
apart from that, i just used the US gov climate map.
several patterns emerge:
1. consistency was very high within regions.
2. the northeast was MUCH worse.
no other region had a state break 100 deaths/mm/wk. 5 NE states did with NY hitting 350.
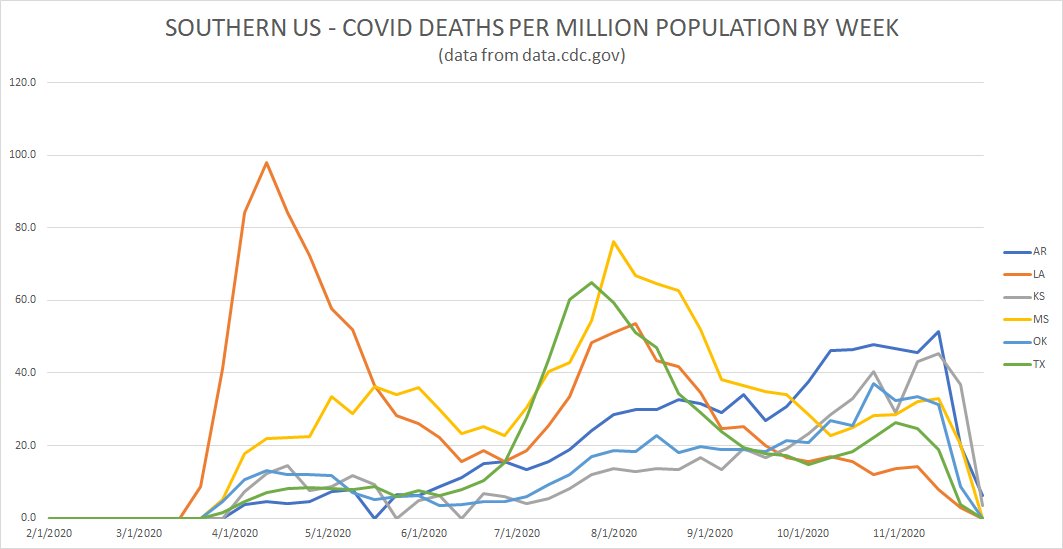
3. the southern US had a markedly later seasonality. this fits with ideas like hope-simpson and with what we saw in mexico/cent/S americas.
no other region had a state break 100 deaths/mm/wk. 5 NE states did with NY hitting 350.
3. the southern US had a markedly later seasonality. this fits with ideas like hope-simpson and with what we saw in mexico/cent/S americas.
we see this again here but with one marked deviation in louisiana.
this appears to have been driven by mardi gras which took place in feb at peak infection and looks to have pulled some but not all of LA into the NE biome.
this appears to have been driven by mardi gras which took place in feb at peak infection and looks to have pulled some but not all of LA into the NE biome.
this leads to a further interesting sub analysis.. LA did not get a double peak surge when you break it down to parish (county) level.
the mardi gras counties went early, others in line with regional season.
but each was distinct. https://twitter.com/boriquagato/status/1295716263029886981?s=20
the mardi gras counties went early, others in line with regional season.
but each was distinct. https://twitter.com/boriquagato/status/1295716263029886981?s=20
many regions looked very similar among them despite varying policies undertaken by states.
this seems to bolster the idea that "virus gonna virus" and that seasonality is the primary driver of disease curve, not policy.
this seems to bolster the idea that "virus gonna virus" and that seasonality is the primary driver of disease curve, not policy.
the northern plains and mountain west, for whatever reason, seem to have a later 3rd seasonality.
many have tried to blame this on something they did, but the uniformity among them makes this claim look dubious.
many have tried to blame this on something they did, but the uniformity among them makes this claim look dubious.
the interesting regions are the ones with outliers or compound surges.
the SW is one such. behavior was largely similar apart from AZ. AZ looks to have been pulled into the southern biome. it peaked like texas. given cross traffic w/ mexico, this seems easy to explain.
the SW is one such. behavior was largely similar apart from AZ. AZ looks to have been pulled into the southern biome. it peaked like texas. given cross traffic w/ mexico, this seems easy to explain.
NM, on the other hand did not. this also makes sense as the NM/mexico border has very little population along it so there was no one to cross pollinate.
this seems reasonable and like a good, parsimonious explanation for AZ/NM divergence.
this seems reasonable and like a good, parsimonious explanation for AZ/NM divergence.
the upper midwest showed an unusual 2 peak saddle shape as a region, but this seems to fall apart on closer examination.
it was really just michigan peaking out of regional season.
i do not have a good theory on why yet.
would love to hear some ideas if people have them.
it was really just michigan peaking out of regional season.
i do not have a good theory on why yet.
would love to hear some ideas if people have them.
the one place that does look to have genuinely had a saddle shaped double peak at low levels was the ohio valley.
there we see 2 peaks of roughly equal size. the reason for this compound season is not clear to me and warrants looking at.
perhaps this breaks down by county?
there we see 2 peaks of roughly equal size. the reason for this compound season is not clear to me and warrants looking at.
perhaps this breaks down by county?
or perhaps it is some seasonal quirk of the region or regional activity like farming. again, theories welcome.
i also found one interesting quirk: a mid-atlantic region with strikingly low deaths.
NC and WV have almost no peak and almost no pattern.
VA, KY not far off.
i also found one interesting quirk: a mid-atlantic region with strikingly low deaths.
NC and WV have almost no peak and almost no pattern.
VA, KY not far off.
this could be a lot of things including just a coincidence.
perhaps it's a regional/climactic sweet spot.
if someone has it, would be fascinating to break this down by county and see what it looks like.
perhaps it's a regional/climactic sweet spot.
if someone has it, would be fascinating to break this down by county and see what it looks like.
obviously, the CDC data lags, is subject to change, and is incomplete in recent weeks. avoid drawing much in the way of conclusions from the last couple weeks.
but that was not really the goal here, the goal was to see how much covid was seasonal/regional.
but that was not really the goal here, the goal was to see how much covid was seasonal/regional.
the answer seems to be "a lot, almost certainly the prime driver."
this is why we need to be very careful with using any one incidence of some policy as proof of anything.
demand to know what happened to the neighbors. https://twitter.com/boriquagato/status/1336043804311363586?s=20
this is why we need to be very careful with using any one incidence of some policy as proof of anything.
demand to know what happened to the neighbors. https://twitter.com/boriquagato/status/1336043804311363586?s=20
this is a great chart that @snorman1776 put together plotting policy stringency vs excess deaths.
correlation is not causality, but material causality without correlation is pretty much impossible.
this makes it awfully hard to argue that it worked.
correlation is not causality, but material causality without correlation is pretty much impossible.
this makes it awfully hard to argue that it worked.
and we see this same lack of variance all over https://twitter.com/boriquagato/status/1329061542571216900?s=20
just as we saw everyone get the same curves as sweden from mar-may. https://twitter.com/boriquagato/status/1266747365609750528?s=20
seasonality/regional issues seem to be THE big driver here. leaving them out of a model will leave you missing most of the story
this is how peru & argentina were mistaken for having had great responses. then their season came. now they are world leaders in deaths per capita
this is how peru & argentina were mistaken for having had great responses. then their season came. now they are world leaders in deaths per capita
because someone will doubtless bring it up, no, the pac rim was not magic. they are not so bizarrely good at NPI that it worked 100 or 1000X better than in other places that did the same.
they had more prior resistance. no other exp really holds water https://twitter.com/boriquagato/status/1330139178999406595?s=20
they had more prior resistance. no other exp really holds water https://twitter.com/boriquagato/status/1330139178999406595?s=20
calling out austrialia policy as though it is some exemplar of success when they look just like many neighbors who did no such thing is a recipe for bad decision making.
be very careful around such claims.
be very careful around such claims.
public policy in 2020 has been dominated not by science but by superstition.
it's time this stopped. another wave of the same pointless panic and punishing policy is not what the doctor ordered.
it's self-harm, not self help.
#DemandBetter
it's time this stopped. another wave of the same pointless panic and punishing policy is not what the doctor ordered.
it's self-harm, not self help.
#DemandBetter

 Read on Twitter


