Analyzed last 12 years of historical data to check if there are any patterns we can observe to find the best time to invest in stocks for long term. #Nifty50 #investing #stocks 1/10
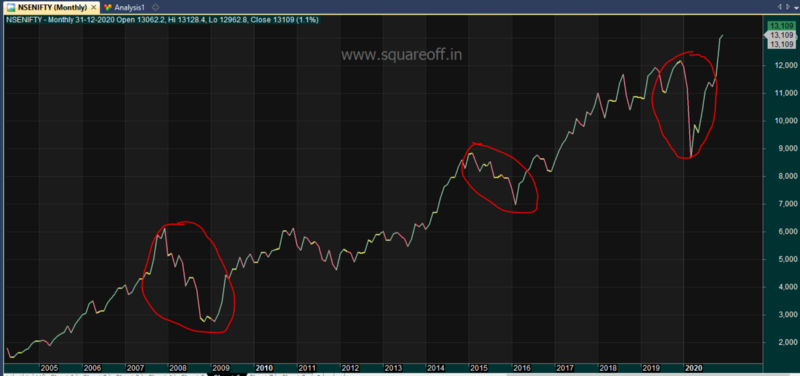
This is how Nifty moved in last 15 years with three major corrections, in the year 2008,then around 2016 and then year 2020 due to Coronavirus. Only when we look back with hindsight bias we could say those were the best time to invest. But is there really any quantitative method?
200 day moving average is something that is widely used by many investors to check for long term trend. Where investors consider if stocks trades above 200 DMA, its in bullish phase and if it trades below 200 DMA its in bearish phase.
We shall run an analysis to find out of Nifty 50 stocks, how many number of stocks trades above 200 day moving average, higher the number, stronger the market. we need correct data, we cannot test it with current Nifty 50 stocks,
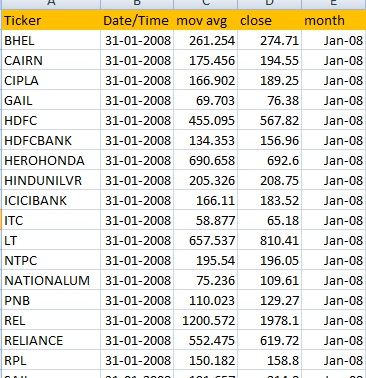
we need list of Nifty 50 stocks that are part of index historically, so when we run for Jan 2008, stocks like RPL, RNRL, UNITECH were part of Nifty 50, so it is essential to test it with correct datasets.
Once we get all the list from 2008 to 2020, we need to find the count for each month, i.e. list of stocks trading above 200 day moving average for each month and plot the graph.
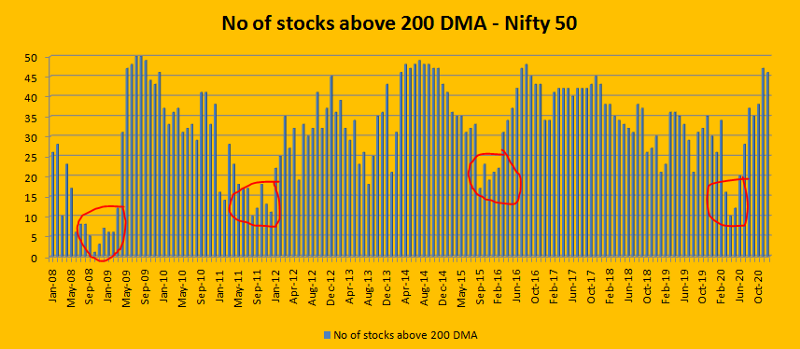
Year 2008 Oct-Dec period, no of stocks trading above 200 DMA was very less, which denotes the extreme fear period, again in 2011, no of stocks that trades above 200 DMA in Nifty 50 were less than 15,
in 2016 no of stocks that trades above 200 DMA in Nifty 50 stocks were less than 20,
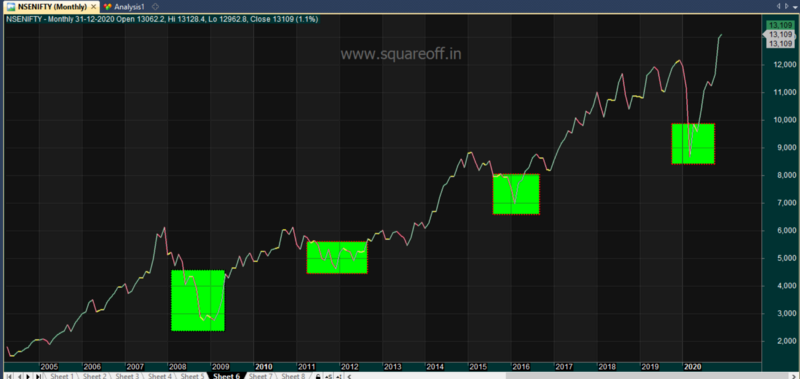
and in the year 2020, its less than 10 stocks, if you compare the above data with below Nifty chart, you can easily conclude that those extreme panic period were the times market bottomed out.
and in the year 2020, its less than 10 stocks, if you compare the above data with below Nifty chart, you can easily conclude that those extreme panic period were the times market bottomed out.
Earlier in April when Corona pandemic was extremely high, I wrote an article stating market has bottomed out ( https://www.squareoff.in/single-post/Is-the-stock-market-bottomed-out )and exactly within 6 months we are now trading at all time high.
Instead of applying 200 dma on index , no of stocks trading above 200 day moving average can be used as a good quantitative measure to make long term investing decision. Because 80% of Index movement comes from less than 20% of Nifty stocks. Blog details https://bit.ly/3lUt4a4

 Read on Twitter


