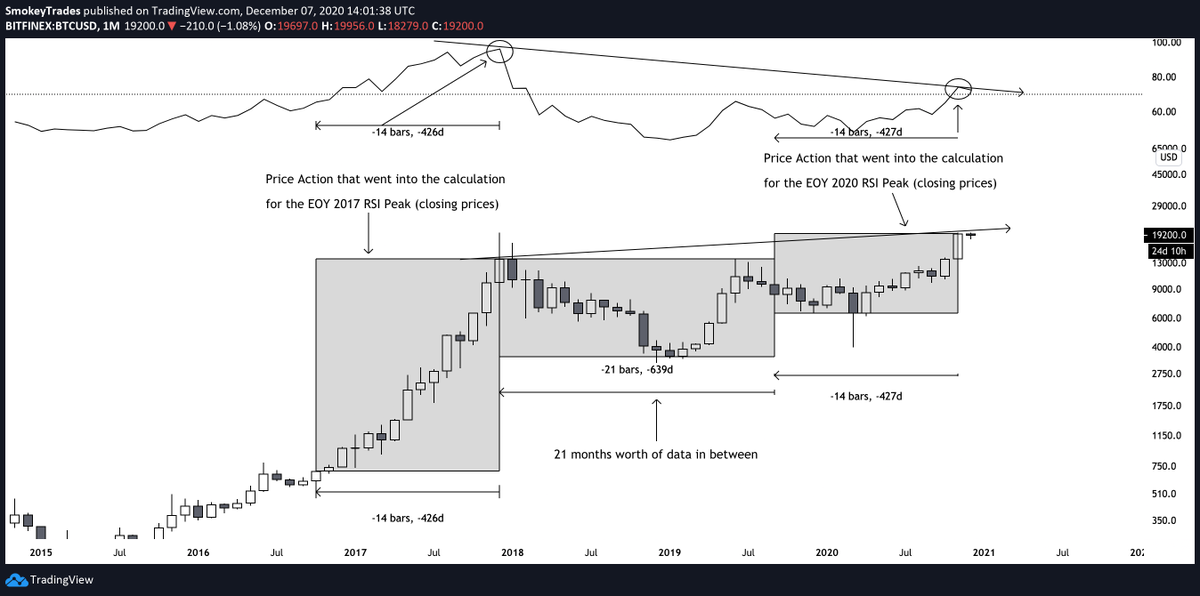
1) Saw some talk about the RSI again in the last couple days
RSI -> Relative Strength Index
It measures relative momentum
Standard settings are 14 bars, in this case 14 months of closing prices
RSI -> Relative Strength Index
It measures relative momentum
Standard settings are 14 bars, in this case 14 months of closing prices
2) What you see on this chart are two RSI peaks with price near 20k. Last closing price this time around 19200, RSI at 74, DEC 2017 closing price at 13800, RSI at 95.
All this means is that relative strength back then was super strong and the trend was up, hard.
All this means is that relative strength back then was super strong and the trend was up, hard.
3) Now Price has risen to similar levels, much higher even on a closing basis, but relative momentum is much lower.
Why?
Well, price started moving up from a much higher level and the uptrend isn't going on for as long as it did back in 2017.
Why?
Well, price started moving up from a much higher level and the uptrend isn't going on for as long as it did back in 2017.
4) What does this mean?
Well. We reached higher closing prices this time, trending for less long but starting from a higher base.
There's still lots and lots of room to grow on HTF. This "bearish div" imo is invalid since too much time passed between both peaks.
Well. We reached higher closing prices this time, trending for less long but starting from a higher base.
There's still lots and lots of room to grow on HTF. This "bearish div" imo is invalid since too much time passed between both peaks.
5) If you need a bearish argument, go for the potential double top, sellwalls, whatever.
HTF RSI isn't one of them.
HTF RSI isn't one of them.

 Read on Twitter


