"Nothing tells you more about a stock than its price." ~Anonymous
Doing some data exercise this weekend to understand what the market is upto. Some observations in this thread:
Doing some data exercise this weekend to understand what the market is upto. Some observations in this thread:
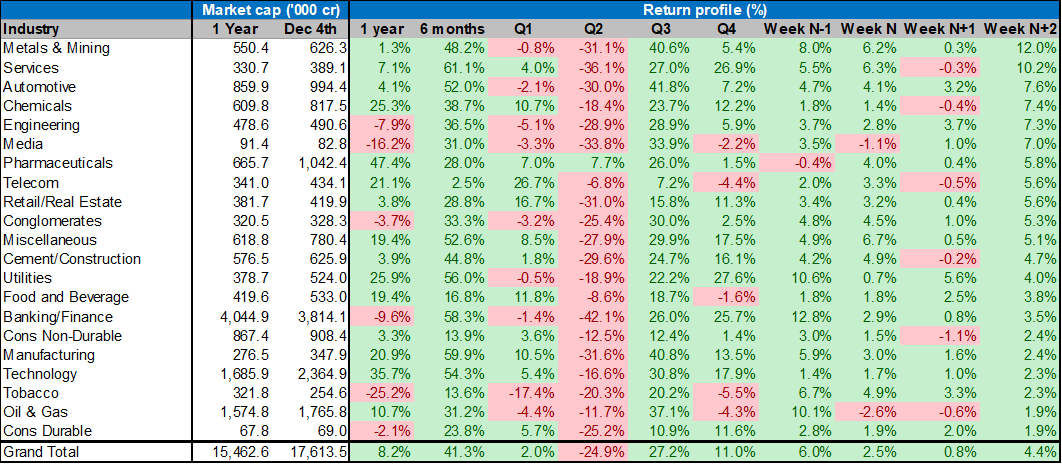
1/ The rally has clearly broadened.
Last week was the first instance in 2 months when all industry segments saw inflows. Old economy segments (Metals, Auto, etc) gaining strength. Pharma, Chemicals making setting up for a fresh rally. Power, utilities sustaining strength.
Last week was the first instance in 2 months when all industry segments saw inflows. Old economy segments (Metals, Auto, etc) gaining strength. Pharma, Chemicals making setting up for a fresh rally. Power, utilities sustaining strength.
2/
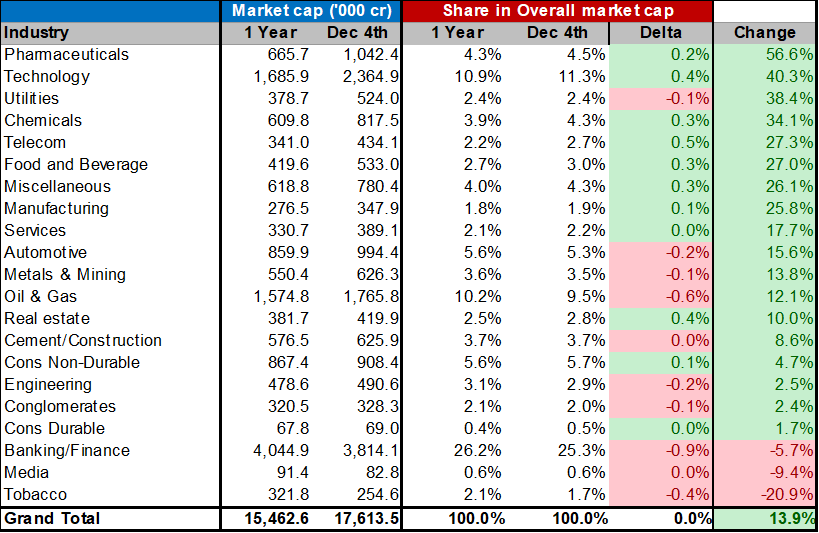
YOY industry wise mcap comparison:
Pharma, Technology, Power & utilities, Chemicals have gained share in index.
Only 3 index still in red - Banking & FS (reviving), Media, Tobacco (possibly due to ESG concerns)
YOY industry wise mcap comparison:
Pharma, Technology, Power & utilities, Chemicals have gained share in index.
Only 3 index still in red - Banking & FS (reviving), Media, Tobacco (possibly due to ESG concerns)
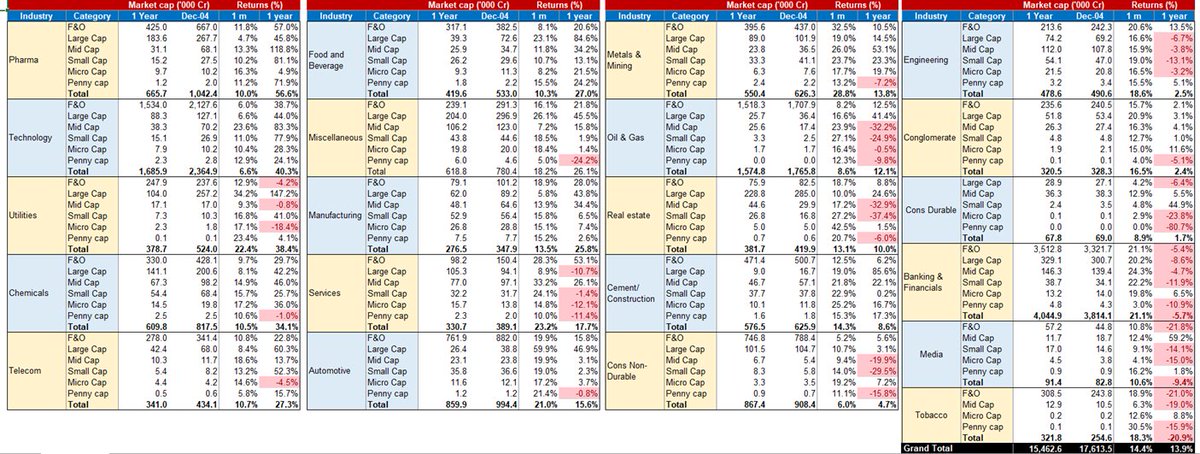
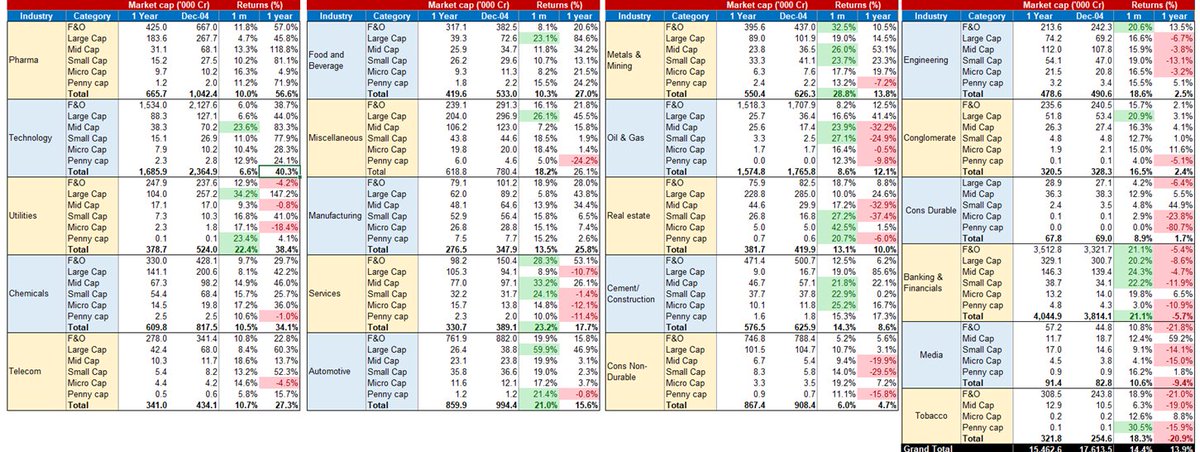
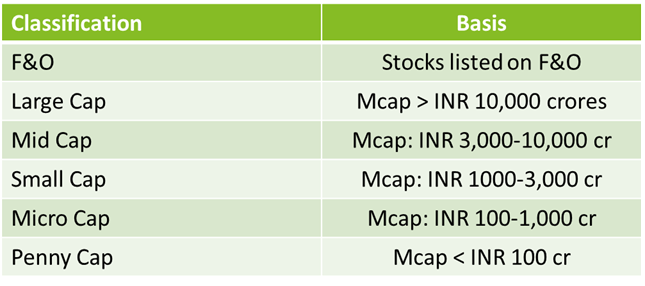
3/ Between Week 1 and week 4 of last month, market has moved from skepticism to optimism on small and microcaps. Still a lot of headroom for catch-up if one looks at yoy data.
4/ Return metrics for last 1 year and last 1 month across industry and size categorization. Helps understand the breath of rally.

 Read on Twitter