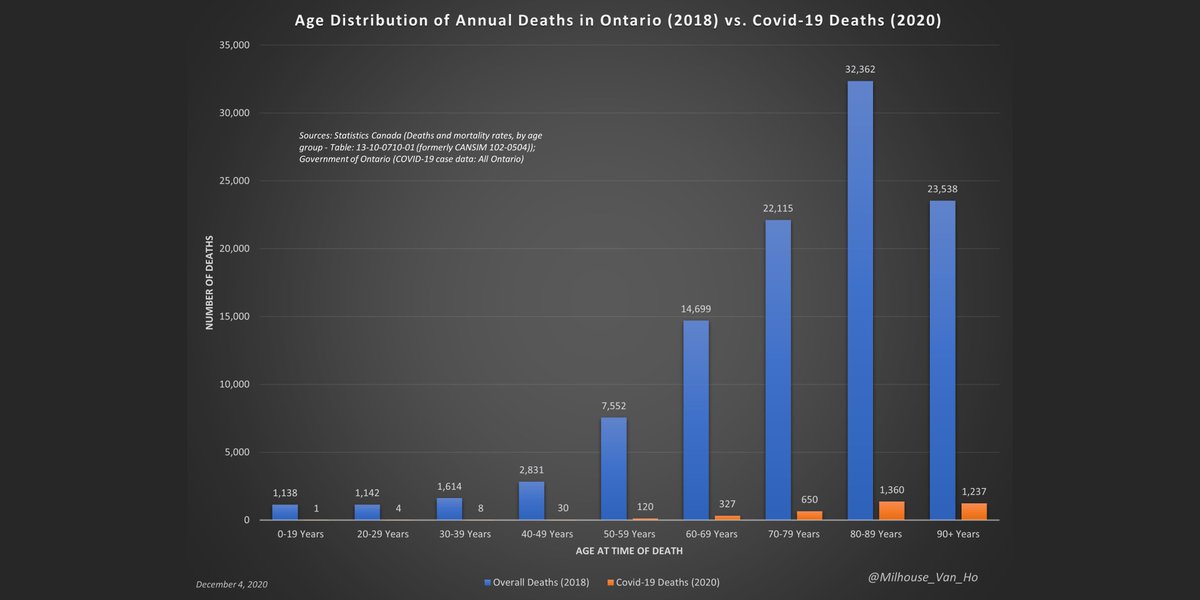
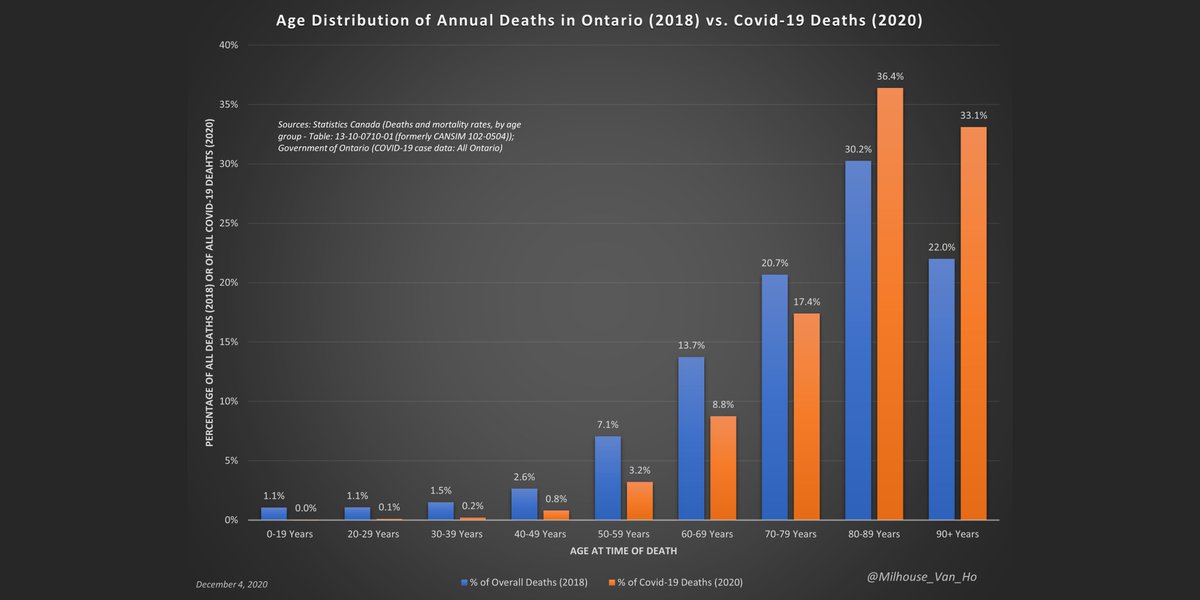
Covid-19 still presents a risk primarily to the elderly, not to children and hardly to working-age adults.
(n.b. Based on 2020 YTD data for Covid-19 - figures to be revised.)
(n.b. Based on 2020 YTD data for Covid-19 - figures to be revised.)
The average age of a death by or with covid-19 is higher than life expectancy.
Deaths among those over 80 account for 69.5% of deaths by/with covid-19, but only 52.2% of all deaths (all causes) in 2018.
More deaths over 90 than under 80.
Deaths among those over 80 account for 69.5% of deaths by/with covid-19, but only 52.2% of all deaths (all causes) in 2018.
More deaths over 90 than under 80.
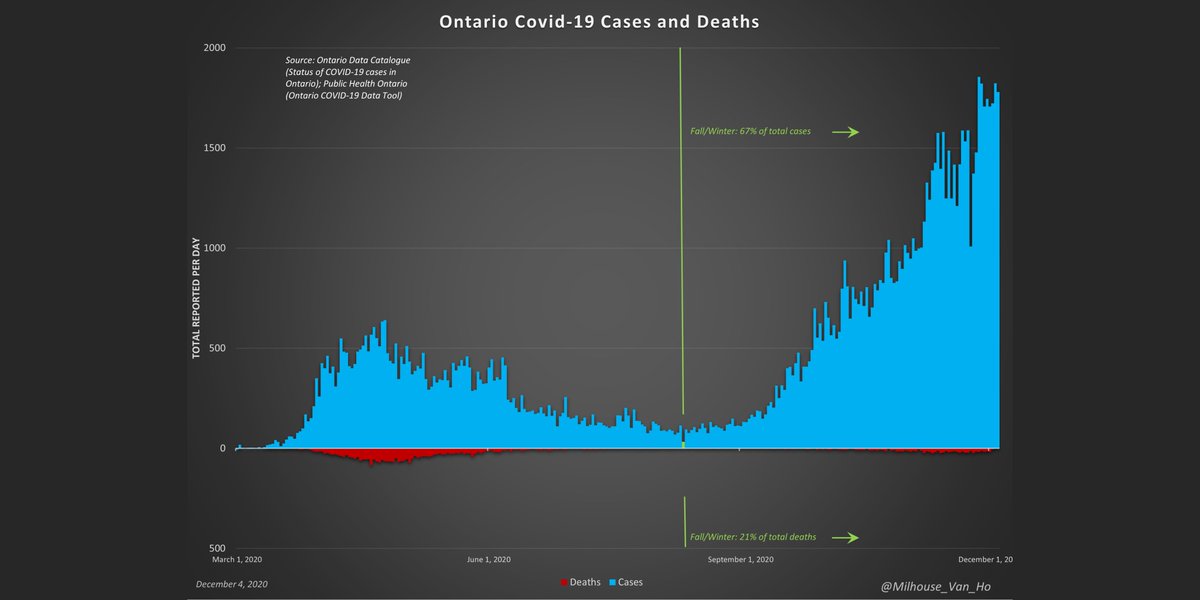
Ontario (population: 14,745,040):
Total deaths by/with covid-19: 3,737 (253 deaths per every million people in ON or 0.03%)
38.8% of Canadian population but 29.9% of Canada deaths by/with covid-19
Total deaths by/with covid-19: 3,737 (253 deaths per every million people in ON or 0.03%)
38.8% of Canadian population but 29.9% of Canada deaths by/with covid-19
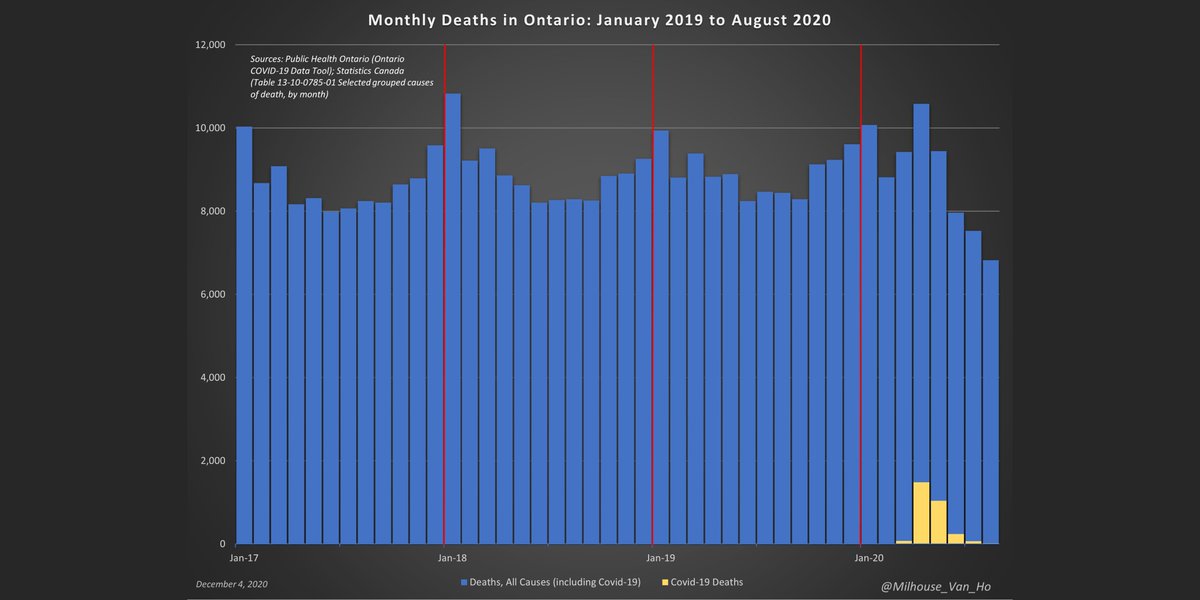
Deaths in Ontario, 2016 - August 2020.
(n.b. Based on 2020 YTD data for Covid-19 - figures to be revised upward as needed.)
(n.b. Based on 2020 YTD data for Covid-19 - figures to be revised upward as needed.)
This is what 2020 might look like in Ontario month-to-month if:
1. All-cause deaths (excl. Covid-19) are in line with 2018-19 averages
2. All Covid-19 deaths are single-cause excess deaths
(n.b. Based on 2020 YTD data for Covid-19 - figures to be revised upward as needed.)
1. All-cause deaths (excl. Covid-19) are in line with 2018-19 averages
2. All Covid-19 deaths are single-cause excess deaths
(n.b. Based on 2020 YTD data for Covid-19 - figures to be revised upward as needed.)
Ontario total deaths 2017-August 2020, including Covid-19. Recent 2020 data may be subject to revision.
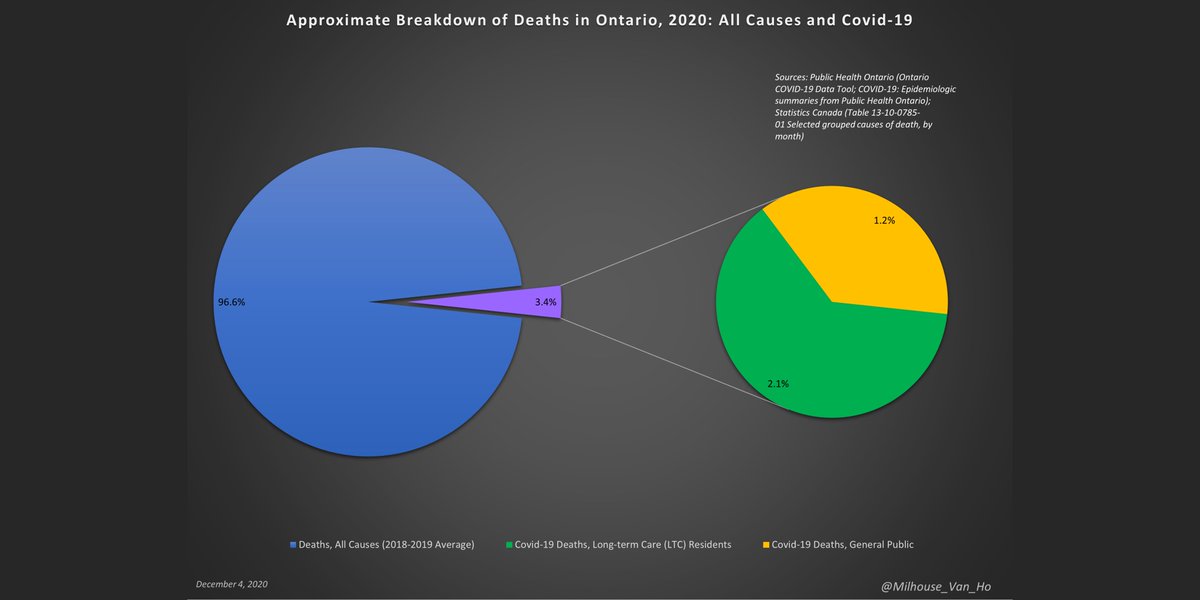
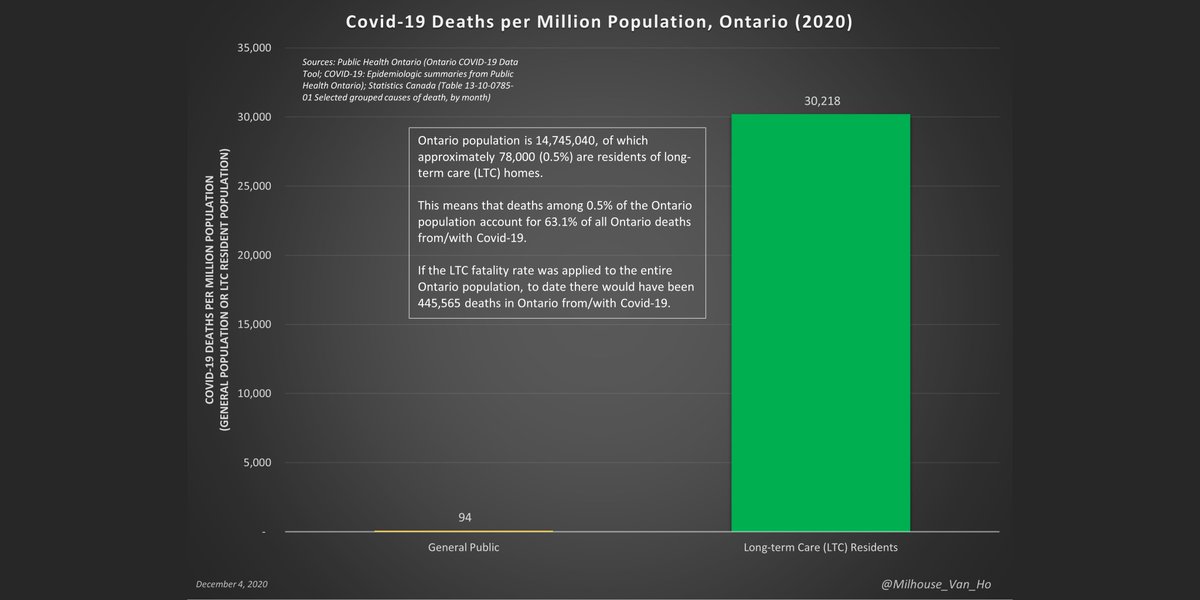
Covid-19 has been a crisis in Ontario's long-term care (LTC) system vs. among the general public.
(n.b. Based on 2020 YTD data for Covid-19 - figures to be revised upward as needed.)
(n.b. Based on 2020 YTD data for Covid-19 - figures to be revised upward as needed.)
Deaths among long-term care residents (0.5% of the Ontario population) account for 63.1% of all Ontario deaths from/with Covid-19.
(n.b. Based on 2020 YTD data for Covid-19 - figures to be revised upward as needed.)
(n.b. Based on 2020 YTD data for Covid-19 - figures to be revised upward as needed.)
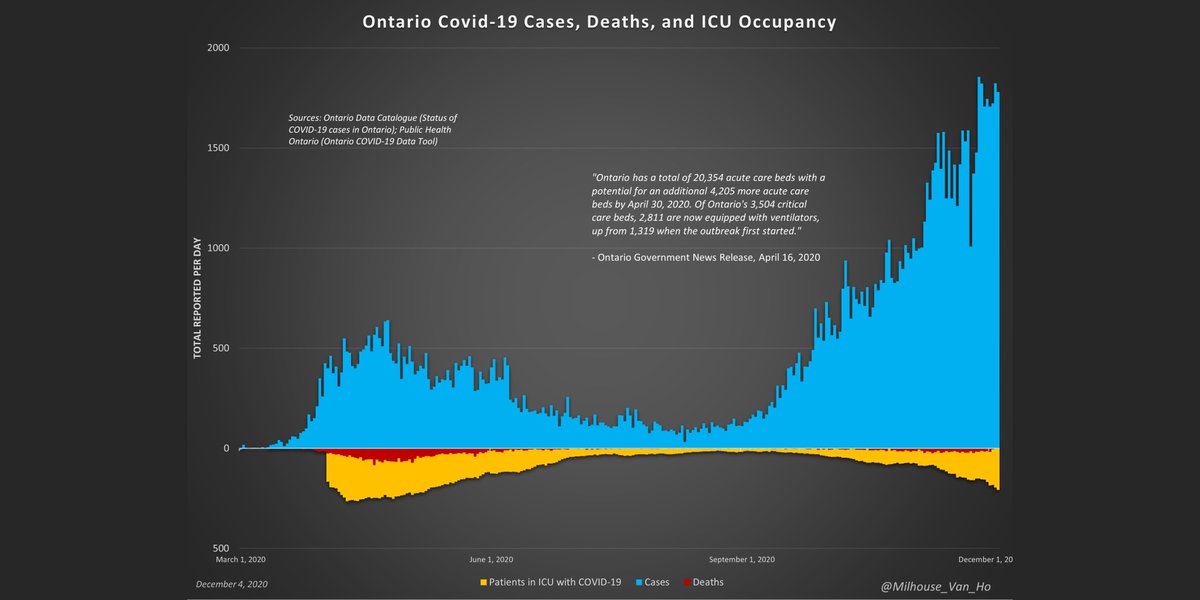
The two most important metrics to watch: deaths and ICU occupancy.
Ontario now reports:
- 207 in ICU (5.9% of max system capacity)
- 116 in ICU on a ventilator (4.1% of max system capacity)
Ontario now reports:
- 207 in ICU (5.9% of max system capacity)
- 116 in ICU on a ventilator (4.1% of max system capacity)
Ontario now reports:
- 207 in ICU (5.9% of max system capacity)
- 116 in ICU on a ventilator (4.1% of max system capacity)
- 207 in ICU (5.9% of max system capacity)
- 116 in ICU on a ventilator (4.1% of max system capacity)
The number of hospitalizations linked to covid-19 in Ontario has generally not approached levels commonly observed for influenza and pneumonia, with even the April peak being comparable only to the summer lull.
As data on daily new hospitalizations is not publicly available, this is the average daily net change in hospitalizations (ICU and non-ICU).
A note on hospitalization data: This may include those who have had a positive test result after being hospitalized for a different reason.
Ontario Fall/Winter season: May be able to declare a peak when average week-over-week growth reaches zero.

 Read on Twitter
