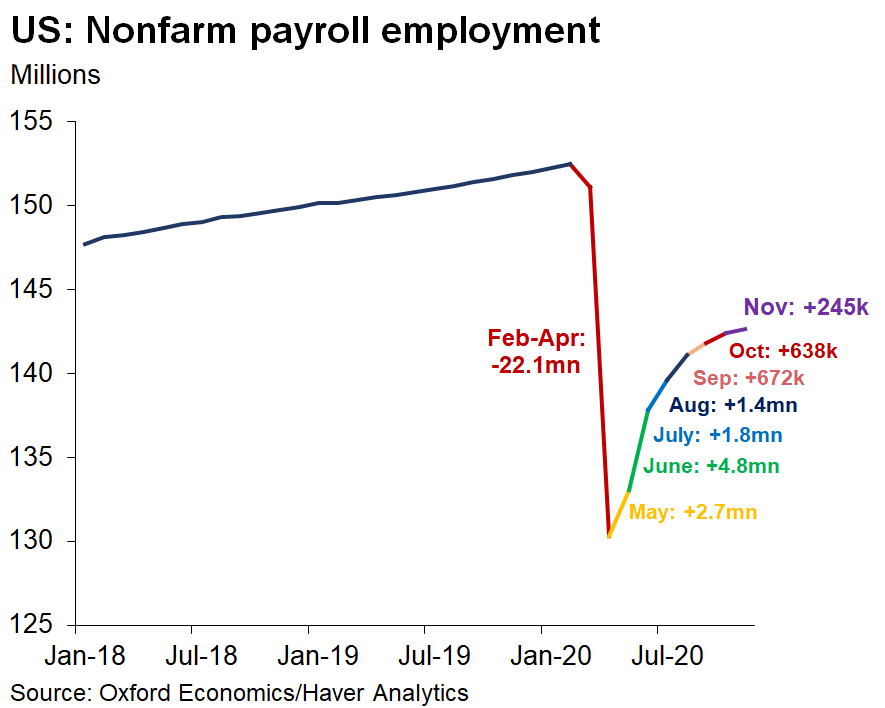
 #Jobsreport +245k in Nov
- Private +344k
- Goods +55k
- Services +289k
- Gov -99k w/ -93k #Census
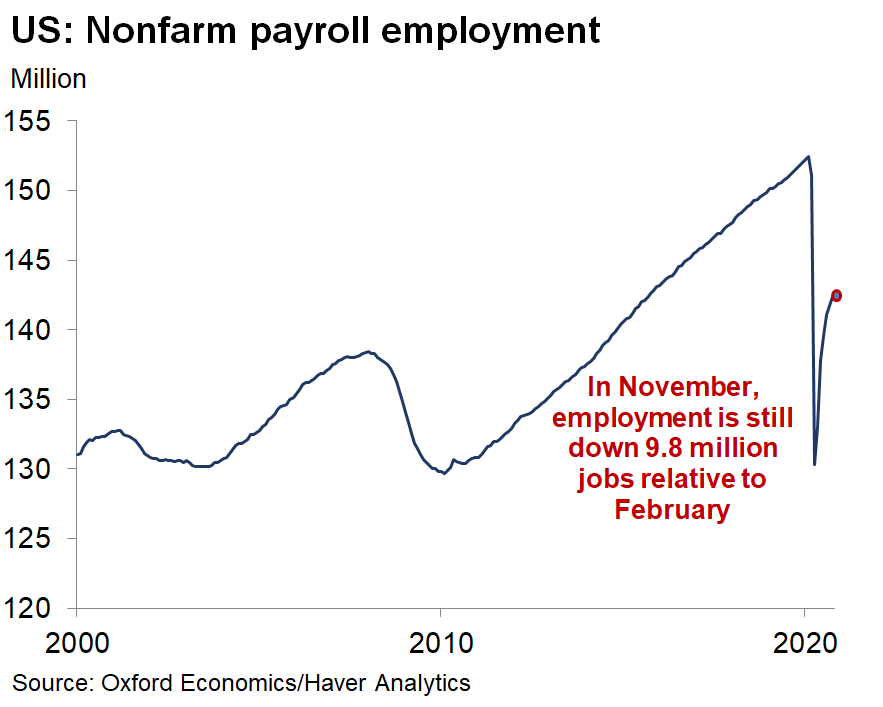
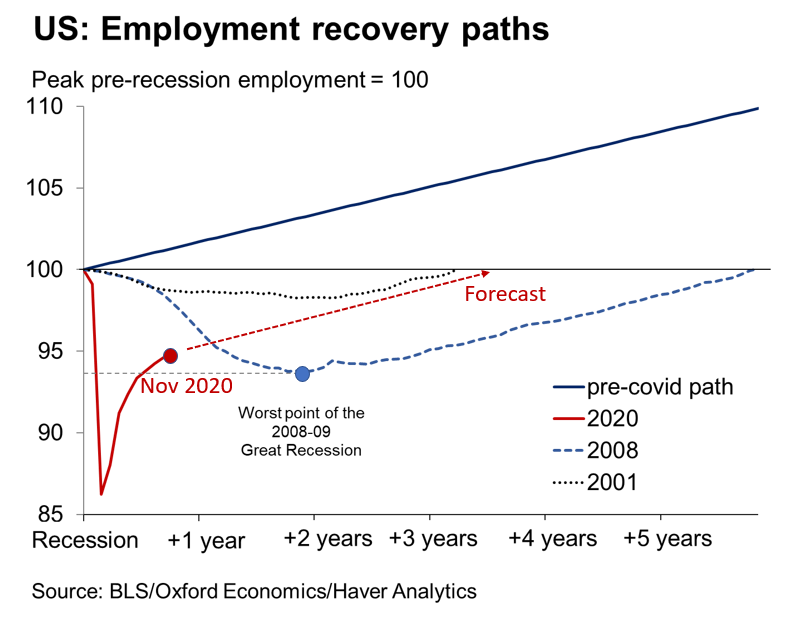
- Job loss since Feb: 9.8mn

- Share of #COVID19 loss regained: 56%
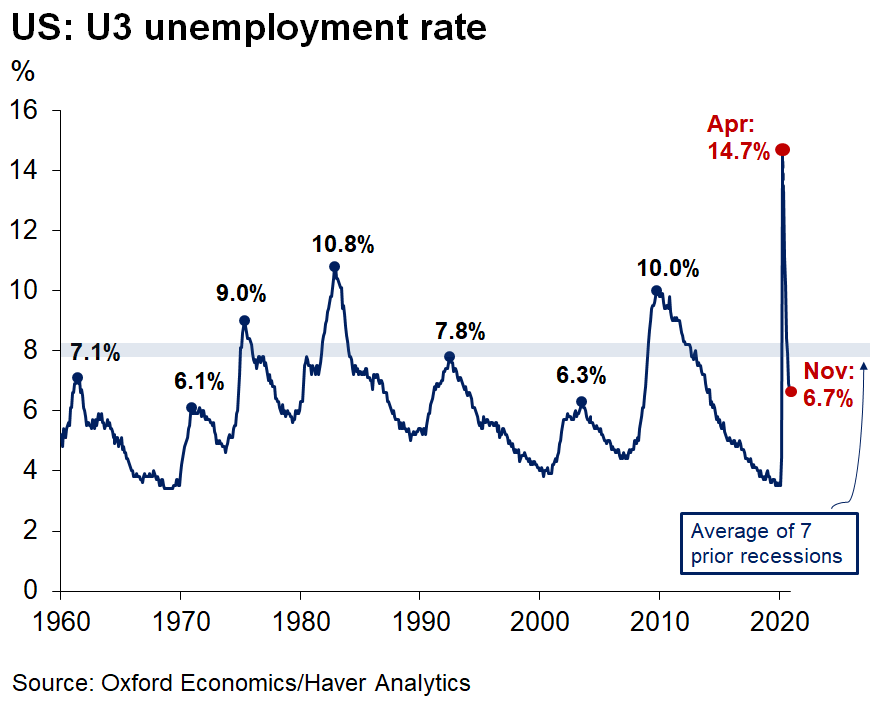
- #Unemployment rate: 6.7% (-0.2pt)
- LFP 61.5% (-0.2pt)

- Share LT unemployed (>27wks): 37%

The "ok" news was that private payrolls +344k
- #transportation +145k led by +82k couriers!
- professional & biz services +60k
- #healthcare +60k
- #manufacturing +27k
- #construction +27k
- #transportation +145k led by +82k couriers!
- professional & biz services +60k
- #healthcare +60k
- #manufacturing +27k
- #construction +27k
The bad news:
- #Retail -35k with losses at brick & mortar stores
- Education -6k
- Restaurants -17k
> this could worsen in the winter given rising #COVID19
- Government employment -99k
- Census -93k
- State employment flat
- Local employment -13k
> Education jobs
- #Retail -35k with losses at brick & mortar stores
- Education -6k
- Restaurants -17k
> this could worsen in the winter given rising #COVID19
- Government employment -99k
- Census -93k
- State employment flat
- Local employment -13k
> Education jobs

This is why the November #jobsreport is disappointing, despite a positive print:
While the progress so far has been, rear-view economics cannot inform the current state of the recovery. We fear the next couple of months will prove difficult for the economy.
While the progress so far has been, rear-view economics cannot inform the current state of the recovery. We fear the next couple of months will prove difficult for the economy.
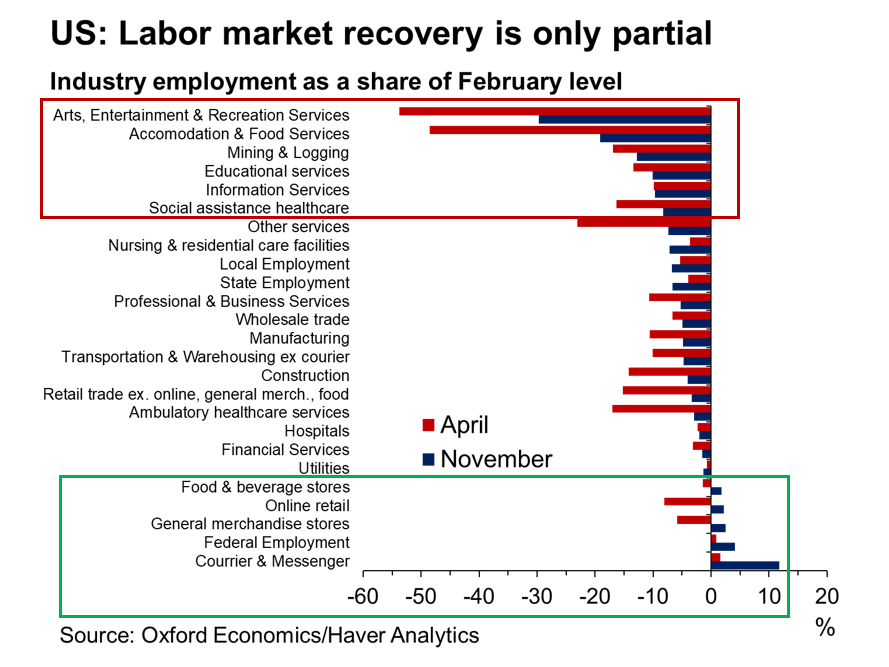
When one looks at the broader picture, it is very encouraging to see some sectors doing better than pre-Covid (grocery, online, couriers, temp Census work), but the risk from lasting damage comes from many key sectors still facing employment shortfalls of more than 10%
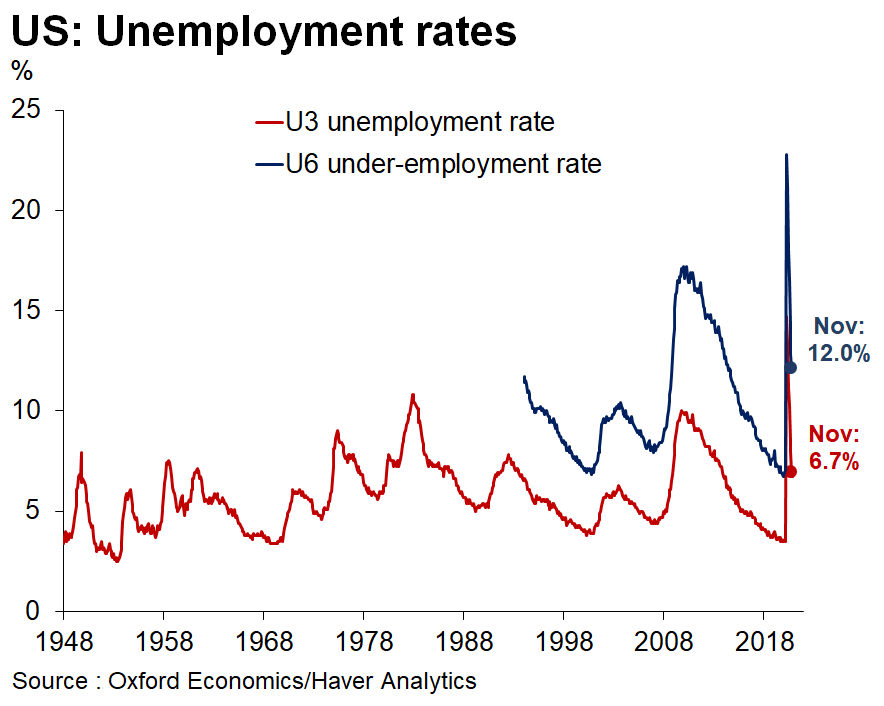
U-3 #unemployment rate -0.2pt to 6.7% is largely a mirage:
- labor force participation -0.2pt & 1.9pt below pre- #Covid
- U-3 still near average PEAK of prior 7 recessions
- adjusting for labor force exit, by choice or obligation, & those miscategorized, the real U-3 closer to 8%
- labor force participation -0.2pt & 1.9pt below pre- #Covid
- U-3 still near average PEAK of prior 7 recessions
- adjusting for labor force exit, by choice or obligation, & those miscategorized, the real U-3 closer to 8%
Adjusting #unemployment rate for the people that have dropped out of the labor force, by choice or obligation, & those categorized as “employed but absent from work”, U3 is likely higher, above 8%
Meanwhile, U6 under-employment rate fell 0.1pt to 12.0% (and also underestimated)
Meanwhile, U6 under-employment rate fell 0.1pt to 12.0% (and also underestimated)
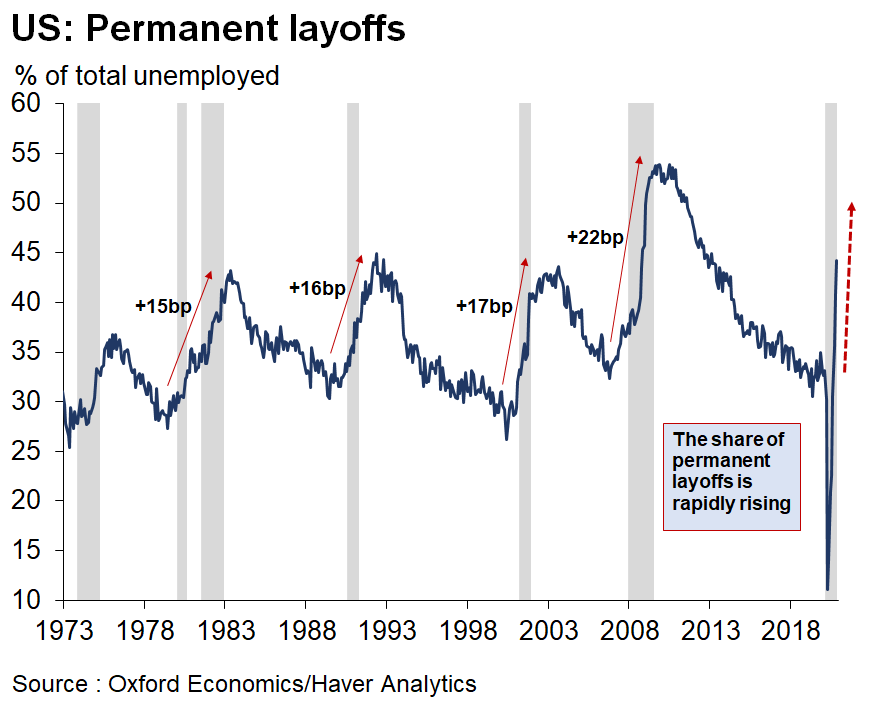
>> Evidence of long-lasting #labor market scarring:
- share of permanent unemployed rose from 41% to 44%
- share of temporary unemployed fell from 29% to 26%
- share of permanent unemployed rose from 41% to 44%
- share of temporary unemployed fell from 29% to 26%
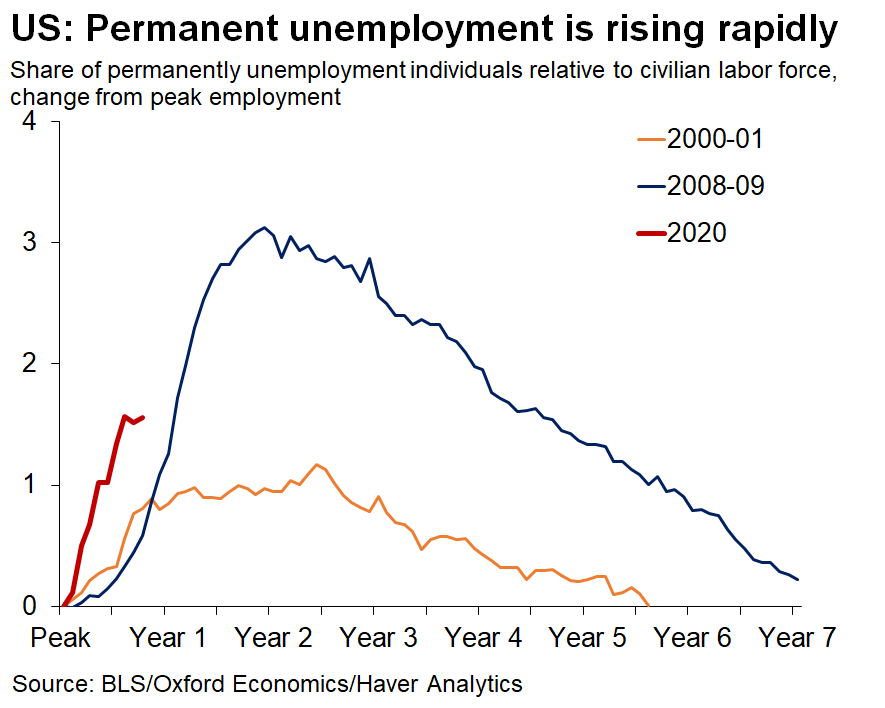
With 4.7 million permanently unemployed individuals, the rise in permanent #unemployment is faster today than during the 2 prior recessions...
Color-coded policy objective:
>> Ensure the red line converges to the yellow instead of the blue...
Color-coded policy objective:
>> Ensure the red line converges to the yellow instead of the blue...
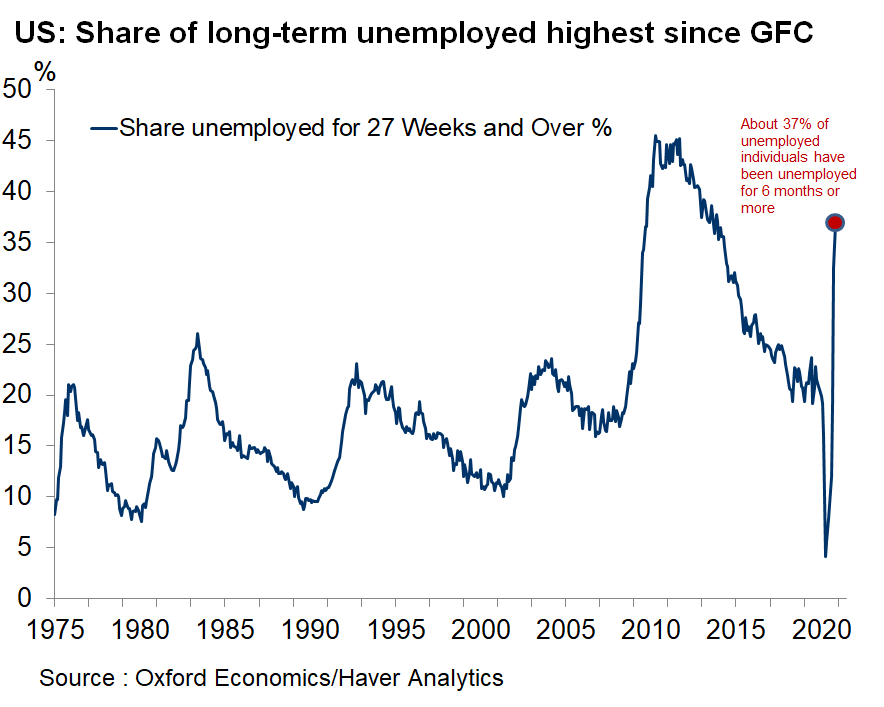
Another concern is #unemployment duration:
 One out of two unemployed individual has been unemployed for more than 15 weeks
 37% of those unemployed have been so for over 27 weeks (from 4% pre- #COVID19)
> With the looming fiscal cliffs fast approaching this is concerning
 One out of two unemployed individual has been unemployed for more than 15 weeks
 37% of those unemployed have been so for over 27 weeks (from 4% pre- #COVID19)
> With the looming fiscal cliffs fast approaching this is concerning

 Read on Twitter