The reasoning given for justifying lockdowns by public health officials (& people) is based on the assumption that lockdowns drive down spread/transmission of a virus by reducing people’s mobility, which leads to less contact between people
#COVID19 #Coronavirus #lockdown #Canada
#COVID19 #Coronavirus #lockdown #Canada
Hence, according to this hypothesis, if a population moves around more during a pandemic, viral transmission should increase, leading to higher cases/infections
#COVID19 #Coronavirus #lockdown #pandemic #science #data #Canada #COVID19ontario #cdnpoli #onpoli
#COVID19 #Coronavirus #lockdown #pandemic #science #data #Canada #COVID19ontario #cdnpoli #onpoli
Does the data support this reasoning for lockdowns? Let’s compare people’s mobility to number of cases in Canada
#COVID19 #Coronavirus #lockdown #pandemic #science #data #Canada #COVID19ontario #cdnpoli #onpoli
#COVID19 #Coronavirus #lockdown #pandemic #science #data #Canada #COVID19ontario #cdnpoli #onpoli
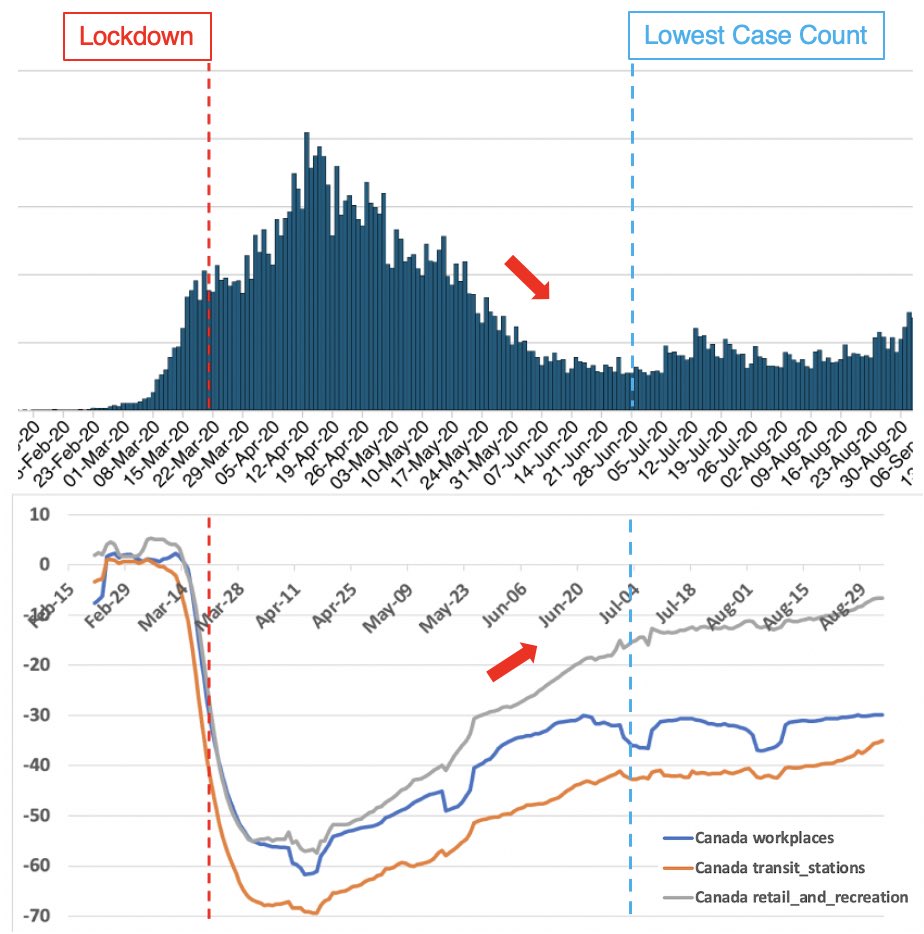
This is the number of cases from January till September. The red dotted line shows when Canada went into lockdown. Data is from Public Health Canada.
#COVID19 #Coronavirus #lockdown #pandemic #science #data #Canada #COVID19ontario #cdnpoli #onpoli
#COVID19 #Coronavirus #lockdown #pandemic #science #data #Canada #COVID19ontario #cdnpoli #onpoli
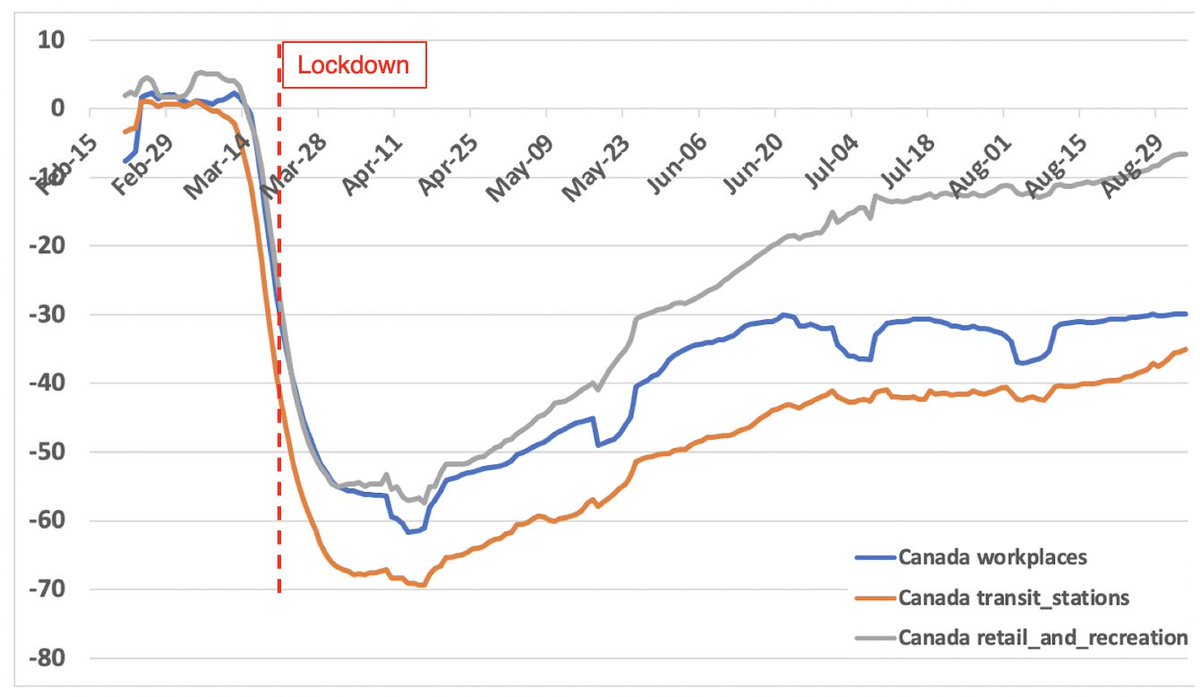
This is people’s mobility in Canada from February to September. As you can clearly see, people’s mobility dropped steeply after lockdowns were introduced, however it started to rise very soon after. Data is from Google Mobility.
#COVID19 #Coronavirus #lockdown #Canada #cdnpoli
#COVID19 #Coronavirus #lockdown #Canada #cdnpoli
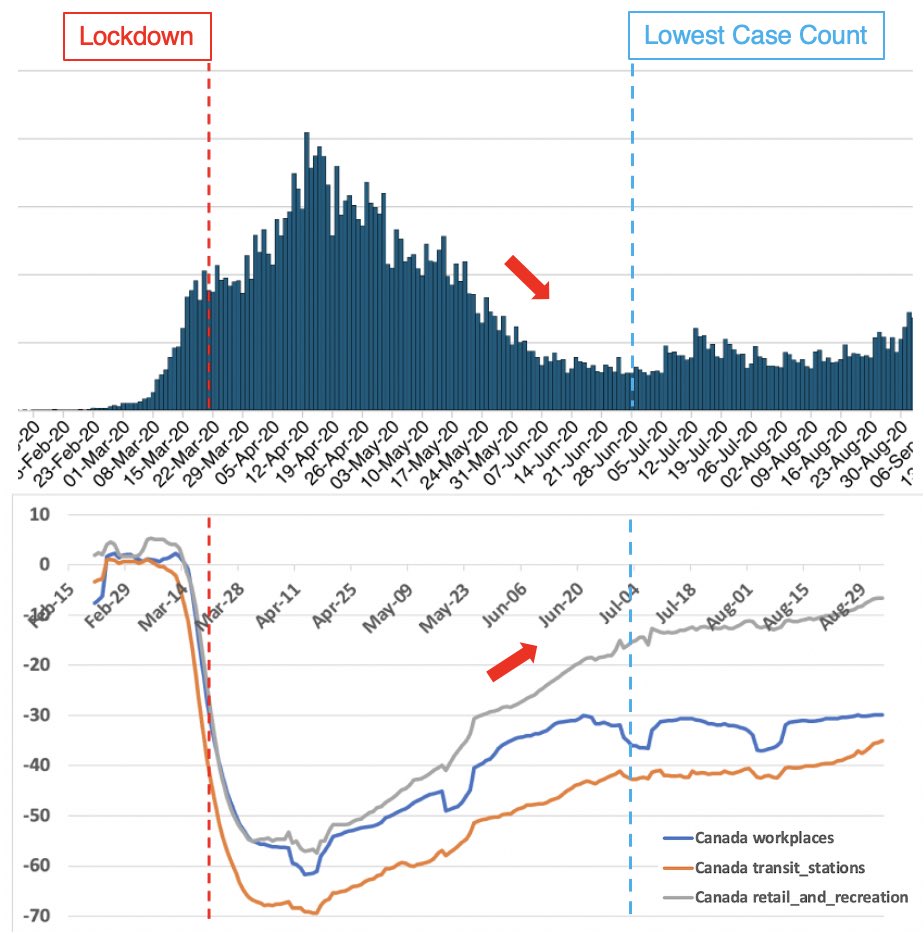
Putting these graphs together you can see that number of cases continue to drop after they peak & at the same time people’s mobility continues to rise without plateauing
#COVID19 #Coronavirus #lockdown #pandemic #science #data #Canada #COVID19ontario #cdnpoli #onpoli
#COVID19 #Coronavirus #lockdown #pandemic #science #data #Canada #COVID19ontario #cdnpoli #onpoli
This is direct contradiction to the reasoning that people & public health officials use to justify lockdowns. People’s mobility has no affect on number of cases.
#COVID19 #Coronavirus #lockdown #pandemic #science #data #Canada #COVID19ontario #cdnpoli #onpoli
#COVID19 #Coronavirus #lockdown #pandemic #science #data #Canada #COVID19ontario #cdnpoli #onpoli
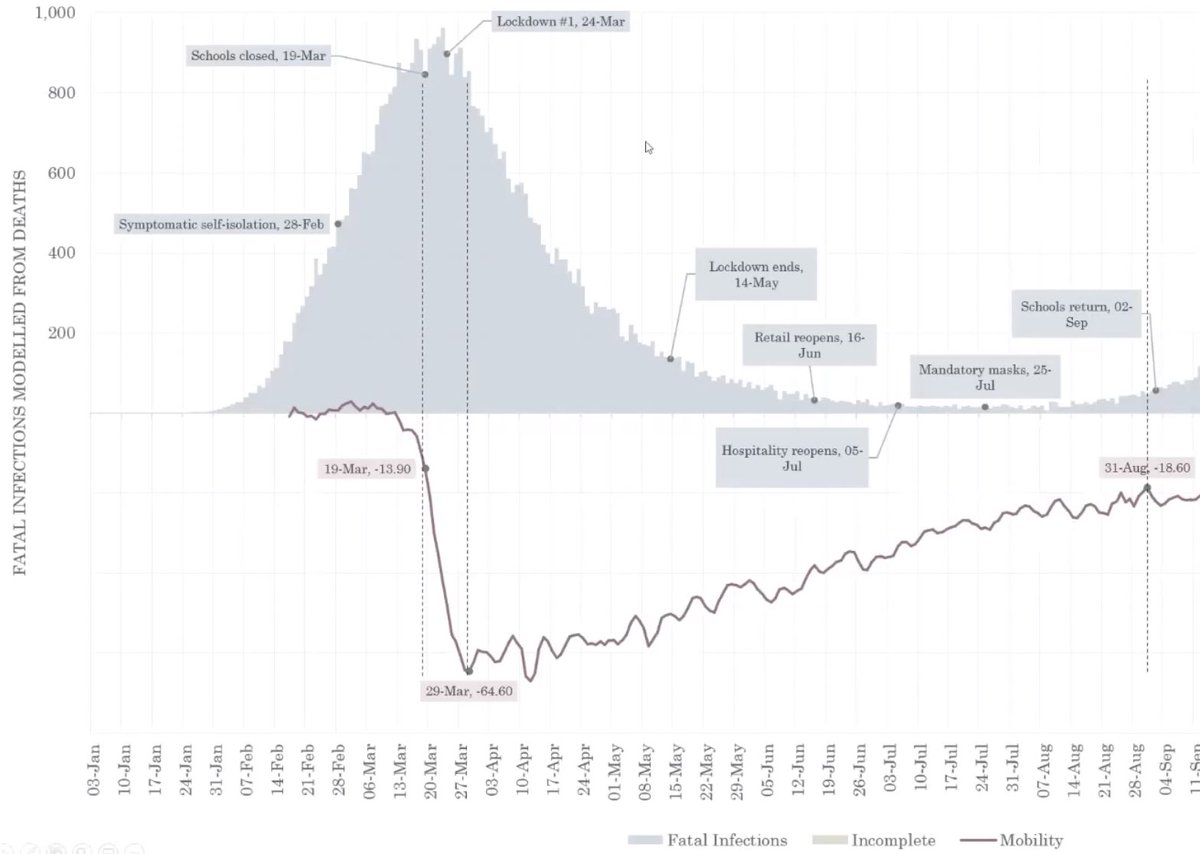
Interestingly, you can see the exact same relationship for England during the similar timeframe. This analysis was done by @RealJoelSmalley & it inspired me to look at Canadian trends. @ClareCraigPath @FatEmperor
#COVID19 #Coronavirus #lockdown #cdnpoli #science #data #Canada
#COVID19 #Coronavirus #lockdown #cdnpoli #science #data #Canada
If your explanation for this inverse relationship between mobility & case number (mid-April to early July) is face masks, they were introduced 7th July, 4 months after cases started to decline & mobility increase. Ironically cases started to  right after masks became mandatory
 right after masks became mandatory

 Read on Twitter


