 Update on Study Release Yesterday
We pulled more data from the technical report to help clarify savings. See thread below. We hope it makes the cost savings discussion more understandable. @DrChrisClack @SolarAccess @JesseJenkins @KenCaldeira @RabagoEnergy #energytwitter
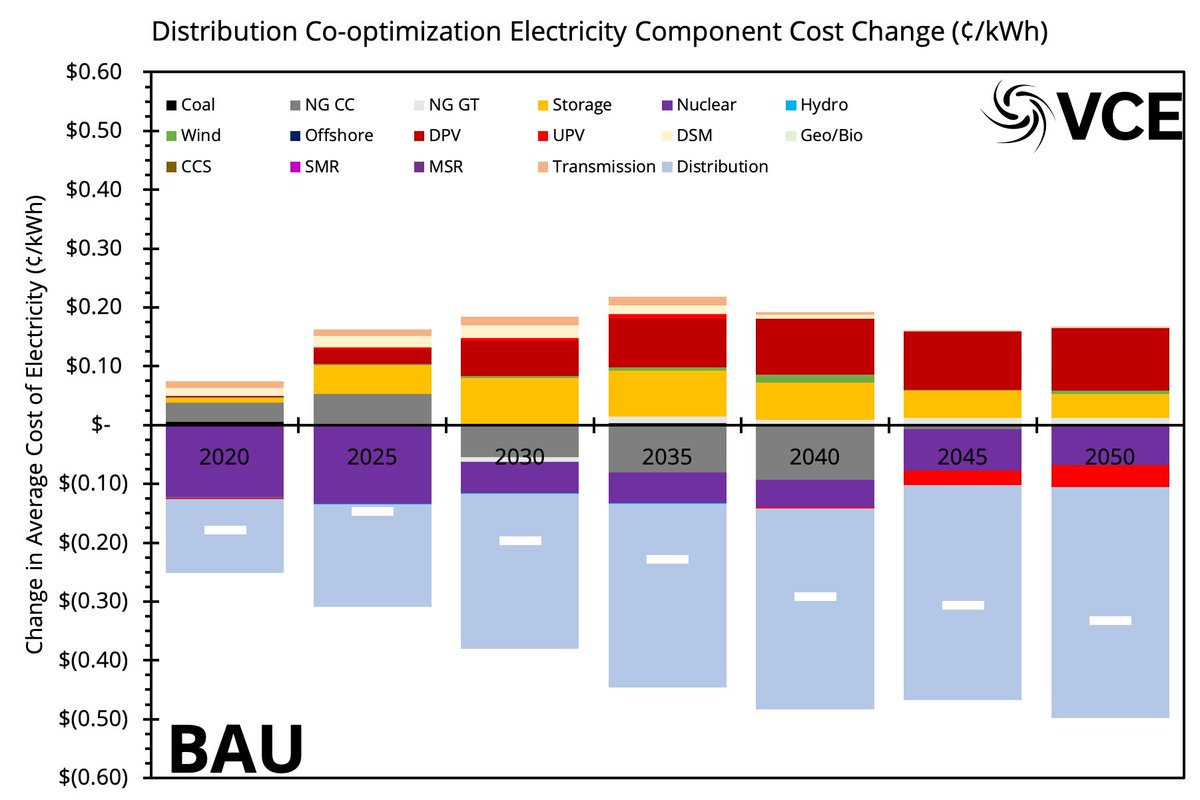
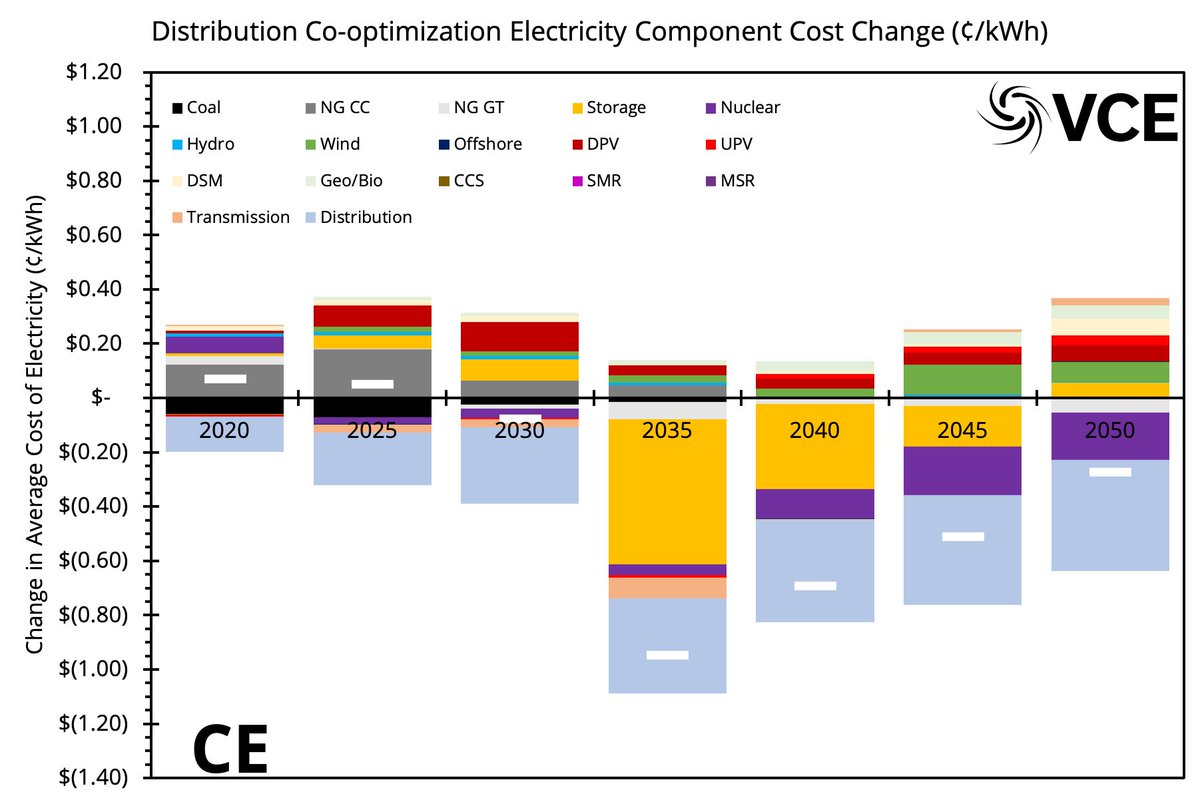
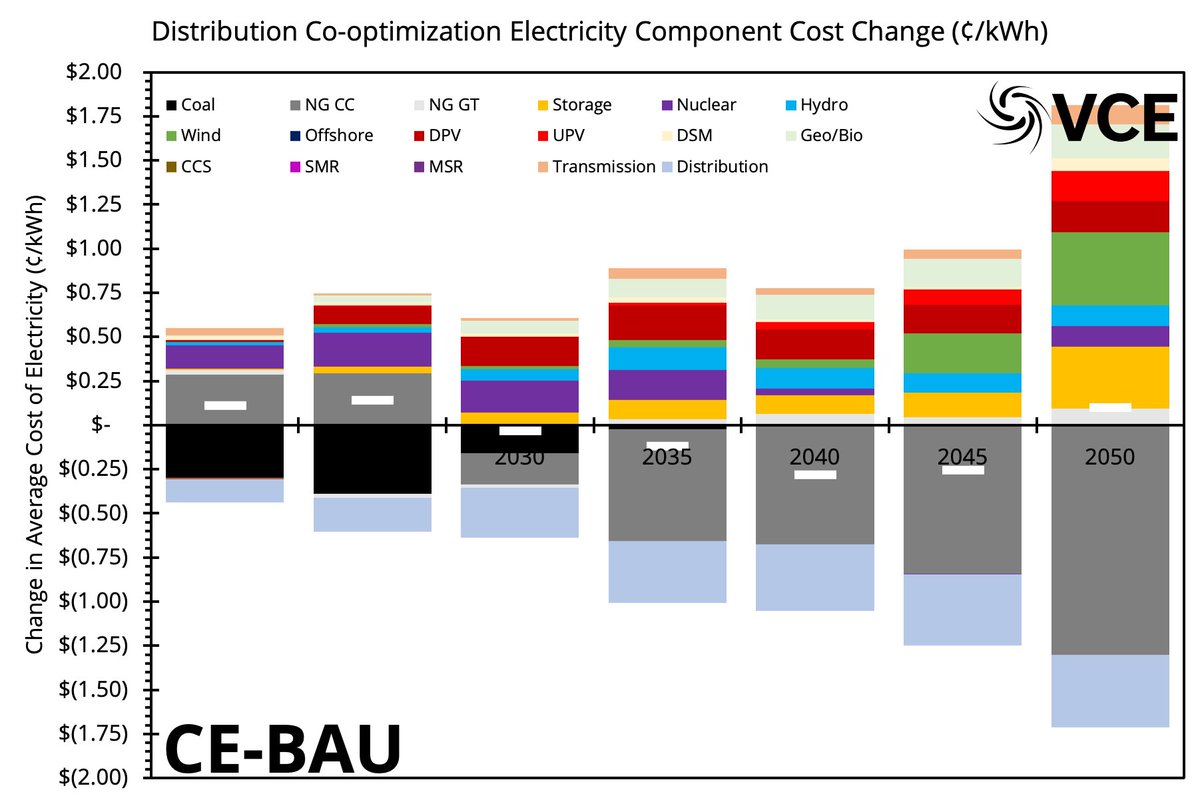
The cost savings are net of cost increases in some components and decreases in others. When comparing between scenarios (w/ & w/o distn co-optimization) we see that large savings do come from distribution. See the images for the BAU and CE differences.
Note that not all the spending was in the distribution grid, the spending changed across the utility and distribution grids. The reduction in costs from all components outweights the additional spending overall. Indeed, less is spent IN the distribution than is saved there.
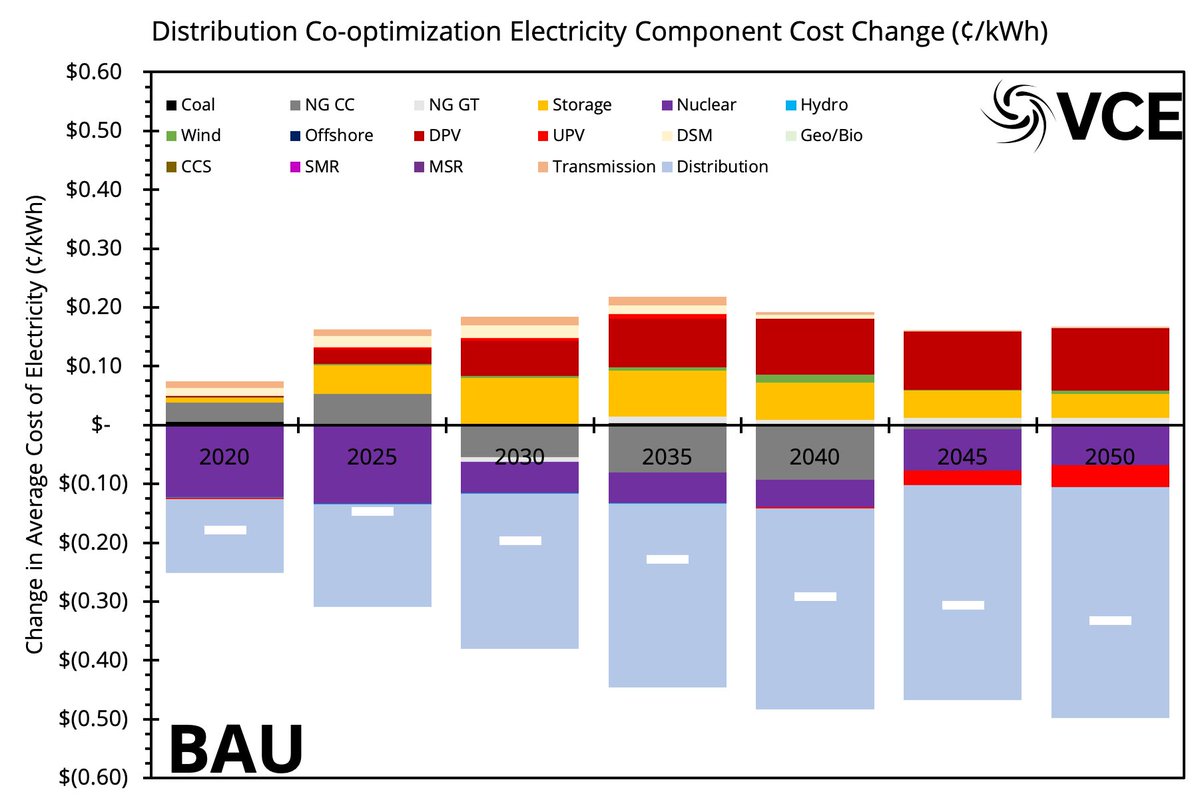
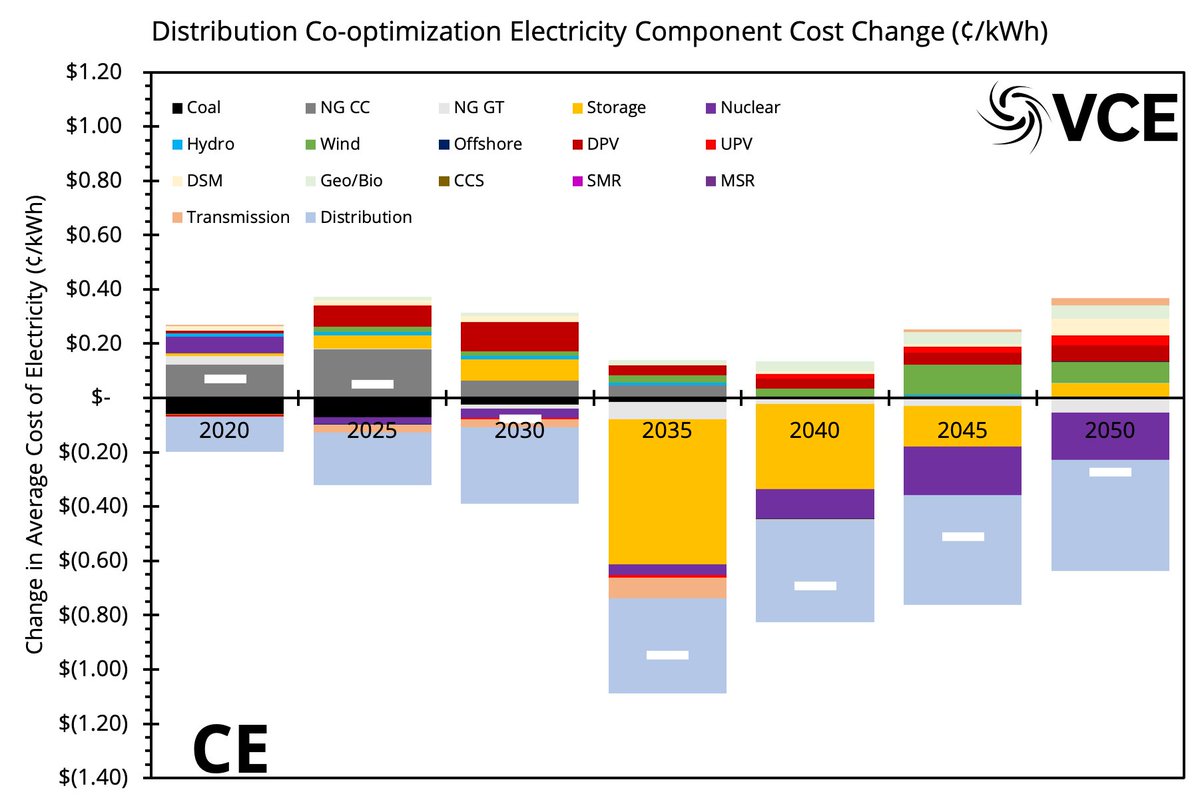
We can also compare the CE with distribution co-optimization with the BAU without co-optimization to see where the spending is diverted to between scenarios. This shows both some savings in distribution AND change in the utility-scale mix (GAS -> VREs).
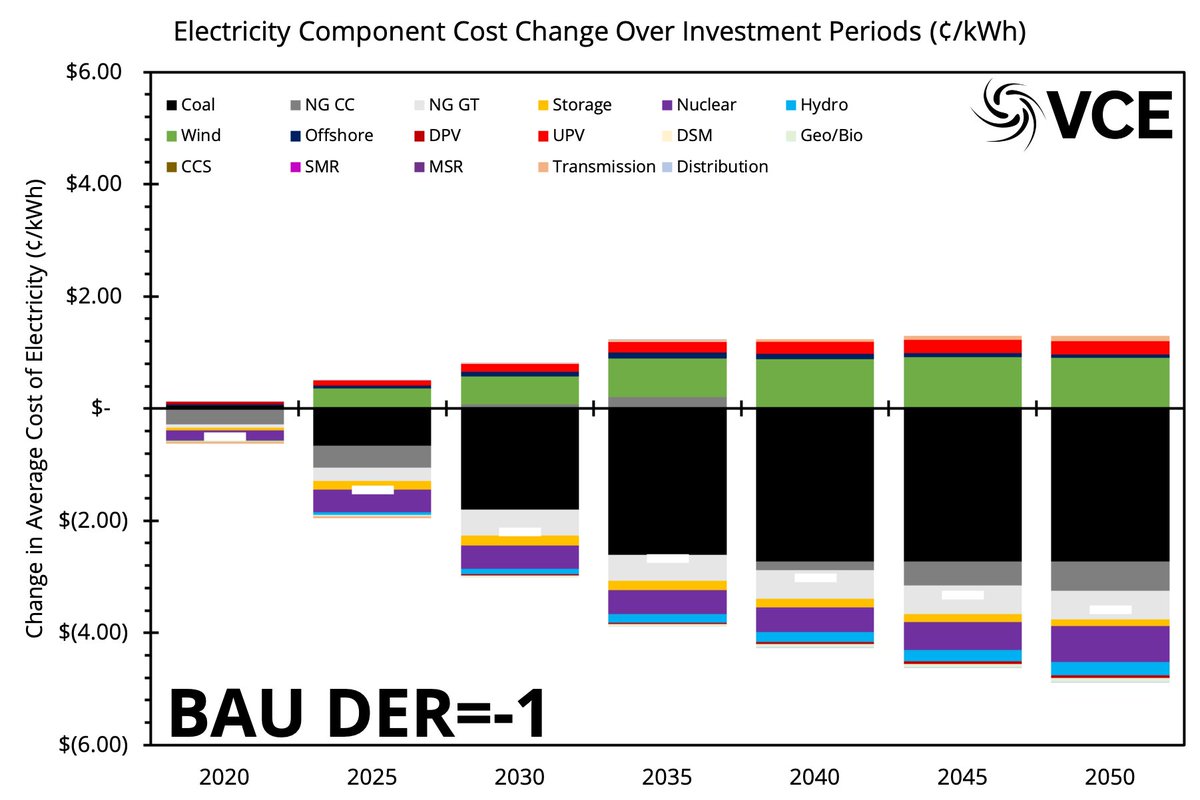
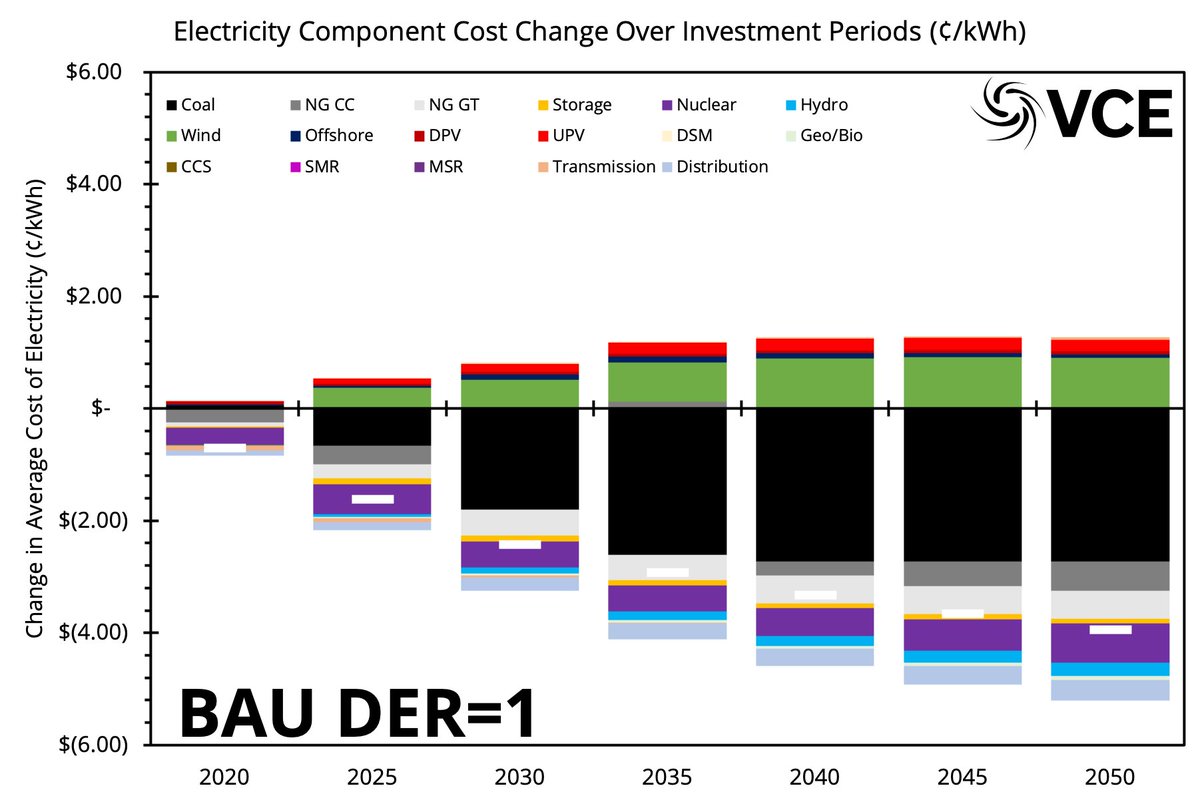
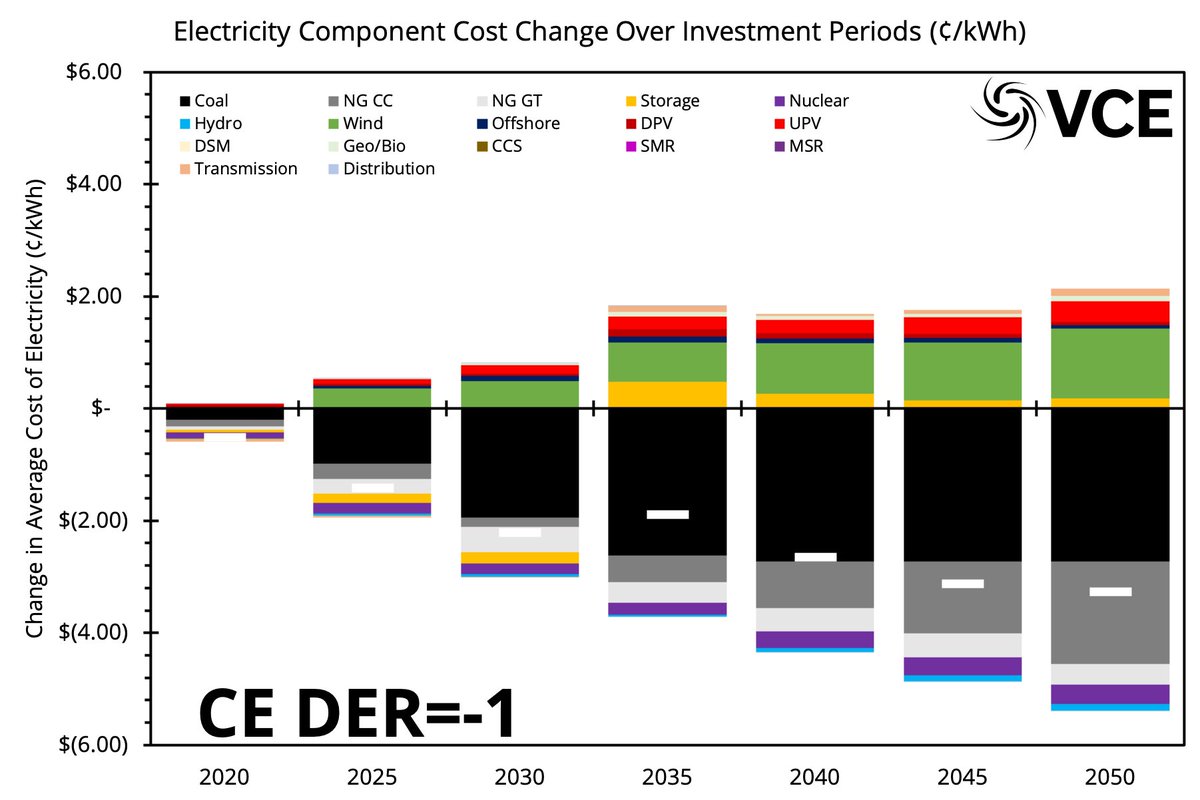
When we talked abt distn. spending not changing much, we did not make it clear that we meant WITHIN a scenario itself. Others have pointed out, correctly, BETWEEN scenarios it does change. Plots here show changes in costs WITHIN scenarios over time. Massive shift FOSSIL -> VREs
Conclusion: We see distribution co-optimization changes both utility and distribution grid investments. Savings outweigh costs (both distn. savings and utility). Within scenarios most savings are coming from FOSSIL -> VRE generation. Sorry for confusion we caused with explainers.
Links to all publicly available documents to date: https://www.vibrantcleanenergy.com/media/reports/

 Read on Twitter
