What does it mean to have a healthy metabolism?
How does it relate to CVD?
These are questions @RaviShah_MD & I explored in our latest paper!
Here's a tweetorial on methods & results, which take a bit of a different approach than many prior studies. https://www.ahajournals.org/doi/full/10.1161/CIRCULATIONAHA.120.047689
How does it relate to CVD?
These are questions @RaviShah_MD & I explored in our latest paper!
Here's a tweetorial on methods & results, which take a bit of a different approach than many prior studies. https://www.ahajournals.org/doi/full/10.1161/CIRCULATIONAHA.120.047689
We started by applying metabolomics to ~2400 people from the CARDIA study
CARDIA is a study of young adults (age 18-30) recruited ~35 yrs ago to watch the development of CVD risk factors & events.
https://www.cardia.dopm.uab.edu/
CARDIA is a study of young adults (age 18-30) recruited ~35 yrs ago to watch the development of CVD risk factors & events.
https://www.cardia.dopm.uab.edu/
We obtained plasma samples from the year 7 exam from ~2400 individuals with good representation of Black & white races, men & women.
Using liquid chromatography & mass spectrometry, our colleagues from @broadinstitute Metabolomics core lab (led by Clary Clish) measured amounts of many, many metabolites.
We focused on a few 100 that we know.
Things like amino acids, biliverdin & adenosine, among others.
We focused on a few 100 that we know.
Things like amino acids, biliverdin & adenosine, among others.
Then we did something a little different. Much of science has been highly reductionist. Pick one or two closely related phenotypes & then see what genes, molecules, etc are related to it.
So we picked a *broad* array of subclinical CVD phenotypes which have been measured over the years in CARDIA including things like CAC, LVEF on echo, LV mass, strain, & exercise duration on treadmill testing.
Then we used standard regression methods to find which metabolites were related to each of these outcomes.
If you look at 1 metabolite at a time w/ 1 subclinical measure, you can find a ton of stuff.
Because you we fit so many models, have to be careful to avoid type I errors in significance tests (p-values).
We used Benjamini-Hochberg FDR correction for this
http://www.jstor.org/stable/2346101
Because you we fit so many models, have to be careful to avoid type I errors in significance tests (p-values).
We used Benjamini-Hochberg FDR correction for this
http://www.jstor.org/stable/2346101
These are volcano plots. They show effect size on y-axis (beta coefficient from regression) & log of the p-value on y-axis.
Big effects are out on the outer arms of the volcano.
Red dots correspond to metabolites that are “significant” despite all the multiple testing.
Big effects are out on the outer arms of the volcano.
Red dots correspond to metabolites that are “significant” despite all the multiple testing.
But these are still largely reductionist approaches.
A lot of them reductionist analyses stacked next to each other but still reductionist.
We wanted to be more holistic.
A lot of them reductionist analyses stacked next to each other but still reductionist.
We wanted to be more holistic.
We wanted to see how *all* the CVD phenotypes are related to *all* the metabolites.
All at once.
*Comprehensively*.
There are a several of ways to do this.
All at once.
*Comprehensively*.
There are a several of ways to do this.
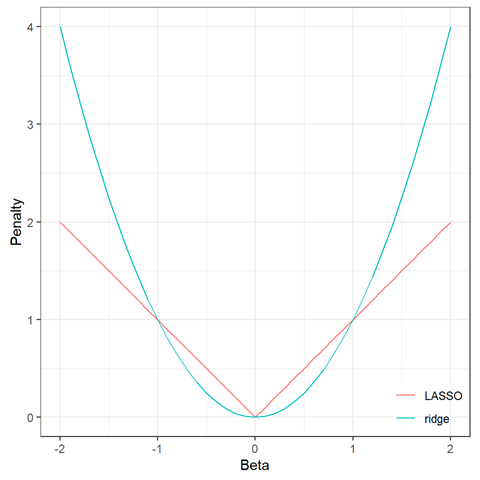
We chose to start with elastic nets.
These have been called by some a form of machine learning, but I think of them more as regression with some safeguards against overfitting.
https://en.wikipedia.org/wiki/Elastic_net_regularization
These have been called by some a form of machine learning, but I think of them more as regression with some safeguards against overfitting.
https://en.wikipedia.org/wiki/Elastic_net_regularization
So we fit a series of elastic nets for each CVD phenotype as the response variable (y-variable) & the metabolites were the predictors (x-variables, 100s of them in the models at the same time).
Elastic nets include penalties to help reduce overfitting. There are some parameters (“hyperparameters”) that need to be tuned to optimize them. This is done with cross-validation.
You can read more about how this works in the supplement to our paper (this was made at reviewer request)
https://aha.prod.cdn.literatumonline.com/circulationaha.120.047689/ca118b0f-1ca4-433f-a3df-d98a85b58aba/circ_circulationaha-2020-047689_supp1.pdf
https://aha.prod.cdn.literatumonline.com/circulationaha.120.047689/ca118b0f-1ca4-433f-a3df-d98a85b58aba/circ_circulationaha-2020-047689_supp1.pdf
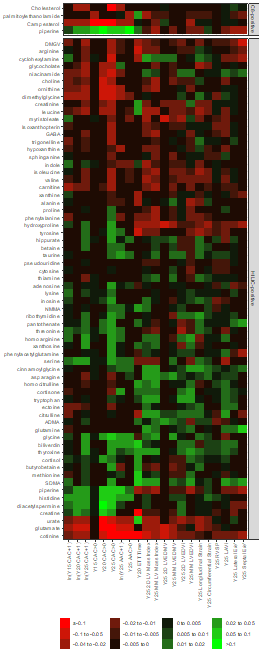
This got us a list of metabolites related to each of the subclinical phenotypes & an effect size (beta coefficient) for each.
We put these all together in a matrix for pretty plotting as a heatmap.
We put these all together in a matrix for pretty plotting as a heatmap.
. @RaviShah_MD immediately recognized the structure within the heatmap. Notice metabolites related to vascular phenotypes follow a different pattern than those related to myocardial phenotypes.
We wanted to rigorously analyze the matrix behind this heatmap figure & see if we could quantitatively separate them out.
We used Principal Component Analysis (PCA) for this.
We used Principal Component Analysis (PCA) for this.
Some people call PCA a form of unsupervised machine learning.
I don’t.
It was developed in 1901 by Karl Pearson (same guy as the correlation coefficient) way before the term machine learning existed.
https://en.wikipedia.org/wiki/Principal_component_analysis
I don’t.
It was developed in 1901 by Karl Pearson (same guy as the correlation coefficient) way before the term machine learning existed.
https://en.wikipedia.org/wiki/Principal_component_analysis
(Pearson was a brilliant guy but also a proponent of eugenics so history has very mixed views of him - rightly).


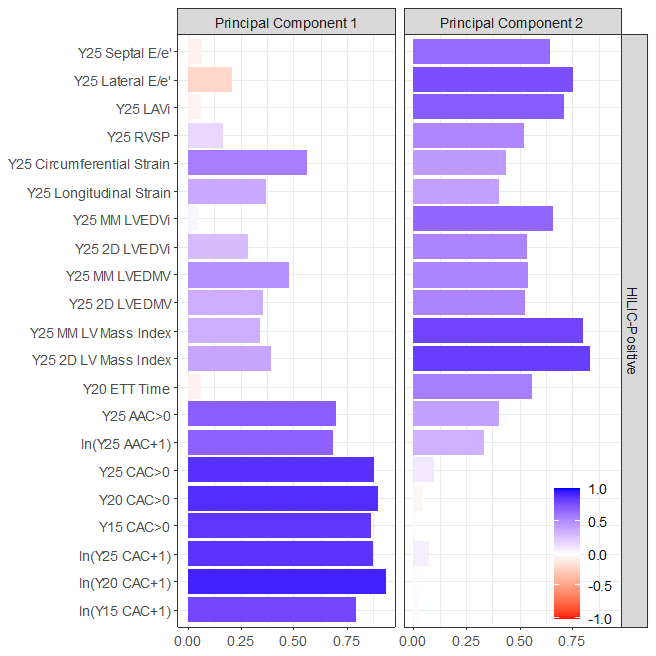
When you apply PCA to the heatmap matrix, vascular & myocardial endpoints separate nicely.
This plot shows the loading of each endpoint on the principal components (PCs).
This plot shows the loading of each endpoint on the principal components (PCs).
We used the metabolite weights from PC1 to calculate a vascular health score for each CARDIA participant.
We used the metabolite weights from PC2 to calculate a myocardial health score.
We used the metabolite weights from PC2 to calculate a myocardial health score.
Metabolite scores for vascular health differed by sex, consistent w/ our understanding that vascular disease tends to affect men at an earlier age.
Interestingly, myocardial health score differed by race, suggesting that metabolism, reflecting environmental/exposure differences, may explain race differences in LV mass & related phenotypes.
We then looked at whether these metabolic scores were related to incident CVD.
They were! Even after adjusting for all standard CVD risk factors.
They were! Even after adjusting for all standard CVD risk factors.
We all care about *both* vascular & myocardial health.
These scores are completely independent so we wanted to check if they were additive.
We built a Cox regression model with both scores & their interaction & found that they were!
These scores are completely independent so we wanted to check if they were additive.
We built a Cox regression model with both scores & their interaction & found that they were!
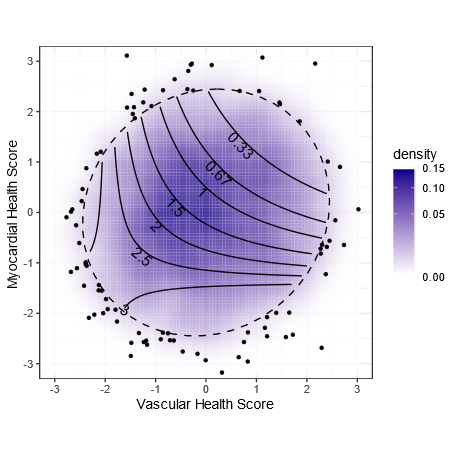
In this plot, the blue cloud shows the distribution of scores for all the individuals we studied in CARDIA. More people in the darker areas.
The points are the outliers outside of the 95% ellipse.
The points are the outliers outside of the 95% ellipse.
The contours show the hazard ratio for CVD.
Being in the lower left (bad metabolic score for vascular health & myocardial health) is associated with a tripling of risk.
Being in the lower left (bad metabolic score for vascular health & myocardial health) is associated with a tripling of risk.
Per standard deviation improvement, the vascular score has a HR of 0.78 (or 1.28 for each SD worse).
For the myocardial score, the effect size is 0.68 per SD improvement (or 1.47 per SD worse)
For the myocardial score, the effect size is 0.68 per SD improvement (or 1.47 per SD worse)
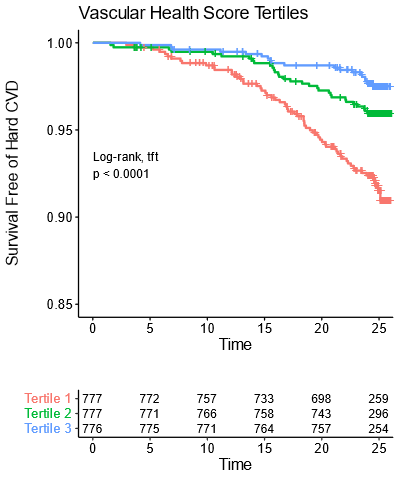
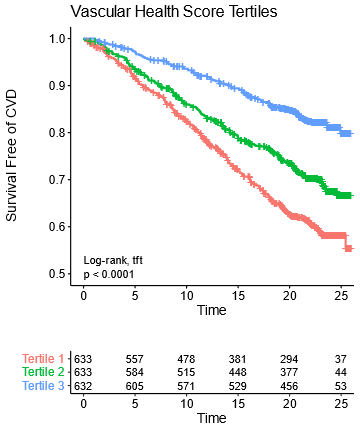
Given the two scores are both bad & there is an interaction such that having both scores be bad is even worse, we added the two scores & made a myocardial-vascular health score. This was more strongly associated with outcomes
Note that over 25 years, the worst tertile (1/3rd) of young adults (mean age 32 years) have a greater than 10% rate of CVD events.
At that point the average age is still only about 57!
At that point the average age is still only about 57!
We then validated this in an independent cohort of patients from the Framingham Offspring Study.
Not as many metabolites were measured there so we had to make slightly simplified scores, which did nearly as well in both CARDIA & Framingham.
Not as many metabolites were measured there so we had to make slightly simplified scores, which did nearly as well in both CARDIA & Framingham.
Note that these plots have 25 years of follow-up & almost *half* the people in the bottom tertile end up with a CVD event!
Because Framingham has a wide range of ages, we could explore a few things we couldn’t in CARDIA (age range in CARDIA spans only 12 years at any given time point).
We found that the effect size for these metabolic scores was greatest in early adulthood.
1 SD worse score up to doubles risk in 4th decade & matters less as one gets older
1 SD worse score up to doubles risk in 4th decade & matters less as one gets older
This emphasizes the importance of early prevention & addressing causes of low metabolic health early.
Other explanations could be our derivation cohort is younger & metabolism-CVD links work differently w/ age.
Survivor bias is another potential issue.
Other explanations could be our derivation cohort is younger & metabolism-CVD links work differently w/ age.
Survivor bias is another potential issue.
Must acknowledge this is really evidence of the value of team science. Would not be possible w/o @RaviShah_MD
Also critical contriubutions from Clary Clish of @broadinstitute for metabolomics
Expertise from @dmljmd @MCarnethon @MattNayor @JaneFreedmanMD & others not on Twitter
Also critical contriubutions from Clary Clish of @broadinstitute for metabolomics
Expertise from @dmljmd @MCarnethon @MattNayor @JaneFreedmanMD & others not on Twitter
Most critically, have to thank participants of the CARDIA and Framingham studies who devote their time to return for many serial exams over several decades and for @nih_nhlbi for funding.
Was this helpful?

 Read on Twitter


