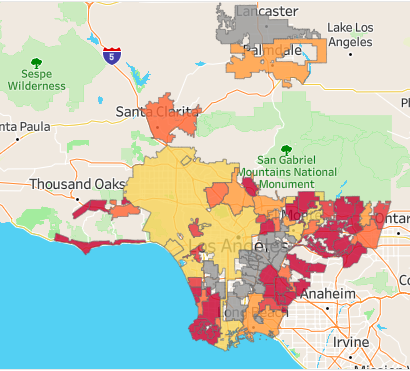
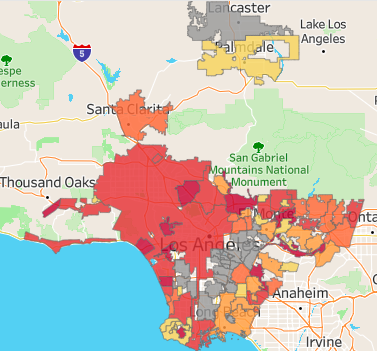
It's no secret that L.A. County is a hotbed of opposition to new housing. For my latest @AbundantHousing data project, I created a methodology to determine which cities are the NIMBYest. (1/n) https://abundanthousingla.org/meet-l-a-countys-biggest-nimbys/
It's difficult to measure to what extent a land use restriction deters housing production, and it's also difficult to make consistent comparisons across cities. (2/n)
Also, simply comparing the % growth in housing supply by city doesn't capture the full picture. Housing growth is influenced by many factors, like overall demand, job growth, and land availability. (3/n)
Fortunately, housing experts like @CSElmendorf and @elpaavo proposed a way to quantify and compare openness to housing across cities. (4/n)
https://papers.ssrn.com/sol3/papers.cfm?abstract_id=3614085
https://papers.ssrn.com/sol3/papers.cfm?abstract_id=3614085
They argue that “local gov'ts in expensive areas have substantial constraints if their rank by housing price (rent) exceeds their rank by rate of housing production.” (5/n)
This makes sense: cities w/high rents should also have high housing growth - high rents signify high demand for housing, and builders should respond to high demand by building housing. So cities w/high rents and low supply growth likely have restrictive land use rules. (6/n)
So I ranked every city in LA County based on median rent and housing growth, and compared the two ranks. I call this the "rent-adjusted housing growth" score. (7/n)
I also ranked each city based on how much housing they've recently permitted that's affordable to lower-income households. 38 cities permitted *no* affordable units between 2014 and 2019. (8/n)
Finally, I included a factor for job-housing balance. Cities w/major job centers have an especially strong obligation to accommodate new housing. Building more homes near jobs improves access to economic opportunity and shortens commutes. (9/n)
By plugging these 3 factors together, I find that Malibu, Westlake Village, and Rolling Hills tie for the worst overall "openness to housing" score. These cities have very high housing costs, as well as flat or negative growth in housing supply. (10/n)
Also rounding out the NIMBYest cities in LA County are Industry, Agoura Hills, Hermosa Beach, Beverly Hills, Torrance, Manhattan Beach, El Segundo, and Palos Verdes Estates.
You can take a closer look at how your city scored here: https://public.tableau.com/profile/anthony.dedousis#!/vizhome/LACountyHousingScores/HousingScorecardforCitiesinL_A_County
(11/n)
You can take a closer look at how your city scored here: https://public.tableau.com/profile/anthony.dedousis#!/vizhome/LACountyHousingScores/HousingScorecardforCitiesinL_A_County
(11/n)

 Read on Twitter


