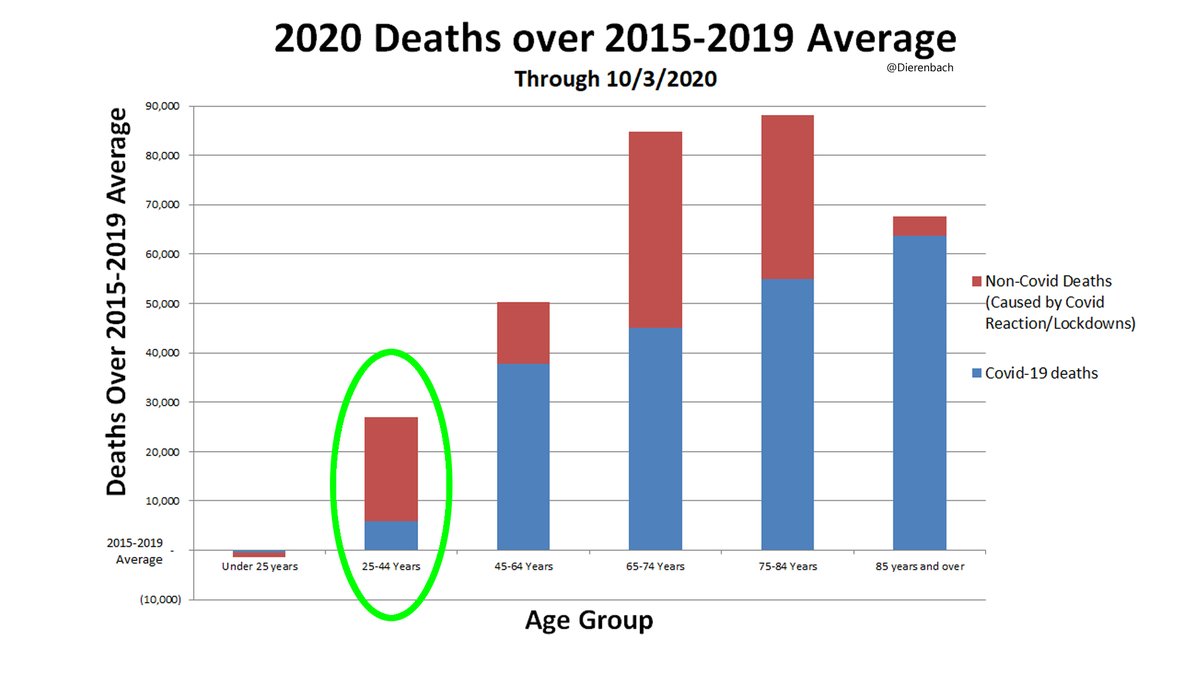
If you're 25-44 years old, you're 3.6 times more likely to die from a cause brought on by our reaction to Covid than Covid itself
If you're under 65, your chances of dying from Covid are about equal to your chances of dying from our reaction to Covid
Data/Analysis follow
1/18
If you're under 65, your chances of dying from Covid are about equal to your chances of dying from our reaction to Covid
Data/Analysis follow
1/18
The base for this chart is average # of deaths that occurred from 2015-2019 (pop adjusted) through week 40. Bars represent 2020 deaths relative to the 2015-2019 average. For example, the 75-84 age group has suffered 88,195 more deaths than their 511,814 2015-2019 average.
2/18
2/18
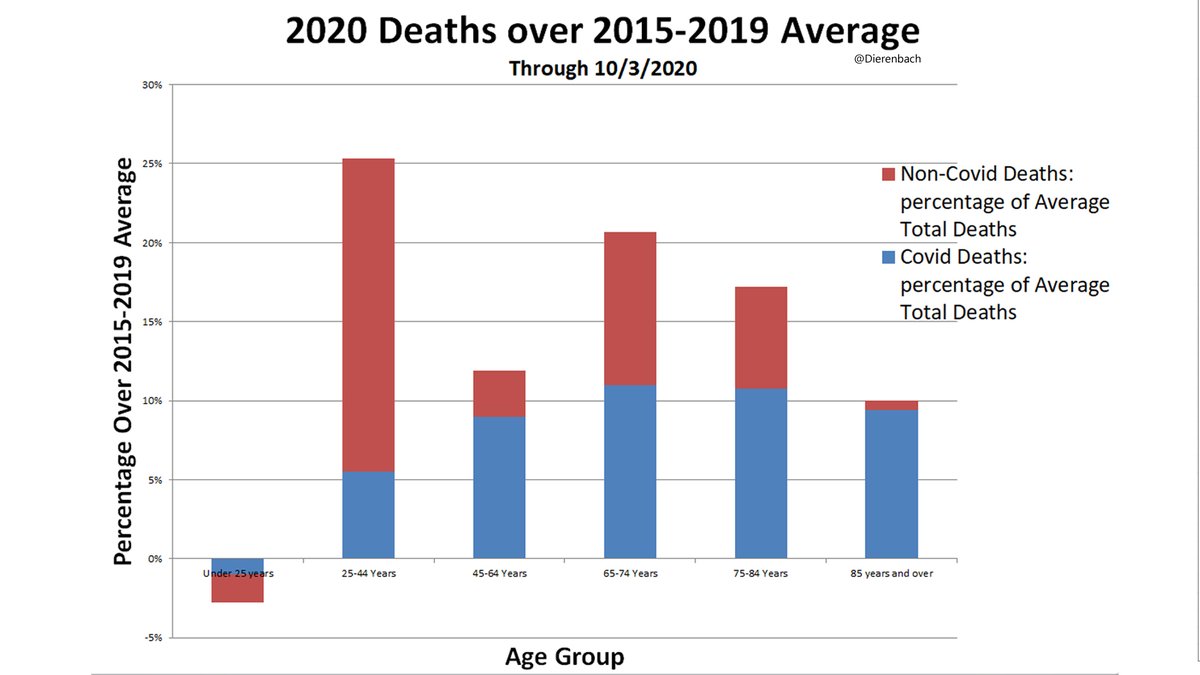
Which brings up next graph: same data but presented as percentages. Here, since younger die at a lower rate, the percentages over normal are larger relative to the older brackets.
Note: death rate for 25-44 has been increased by 25% - almost entirely due to Covid reaction
3/18
Note: death rate for 25-44 has been increased by 25% - almost entirely due to Covid reaction
3/18
Finally, here’s a chart of specific causes and their associated 2020 increase over the 2015-2019 average.
That’s the data, but what does it mean?
4/18
That’s the data, but what does it mean?
4/18
Here I move from straight data to analysis. I welcome any input or theories.
First, good to see overall deaths remain lower than average for under 25. This may be because many of this group are under the care of parents who aren't hesitating to seek care in an emergency.
5/18
First, good to see overall deaths remain lower than average for under 25. This may be because many of this group are under the care of parents who aren't hesitating to seek care in an emergency.
5/18
25-44 Group is most troubling. Here Nonpharmaceutical Interventions (NPIs – lockdowns, closures, etc.) are having greatest effect. This may be group hit hardest by deaths of despair (suicide, overdose, etc). They may be slow to respond to health emergencies due to isolation
6/18
6/18
Bottom line is 25-44 age group is 3.6 times more likely to die from effects of NPIs than to become a Covid-labeled death. Given their young age, this is a huge source of Years of Life Lost (YLL). I discussed possible reasons for all groups in June.
7/18 https://pagetwo.completecolorado.com/2020/06/11/dierenbach-the-coronavirus-response-has-been-deadly/
7/18 https://pagetwo.completecolorado.com/2020/06/11/dierenbach-the-coronavirus-response-has-been-deadly/
45-64 seems relatively impervious to NPIs. Perhaps because excess deaths we are seeing tend to hit older people (particularly Alzheimer’s), & many in this group may be beyond the despair stage, have families, and are less hesitant to seek medical help in an emergency.
8/18
8/18
For 65-74, NPI related deaths are about equal to Covid-labeled deaths. In other words, for every Covid-labeled death in this group, our reaction has killed a non-Covid person. Also, here we may start to see untreated natural causes and Long-Term Care (LTC) facility deaths.
9/18
9/18
Ages 75-84 are similar with a slightly lower ratio of NPI related to Covid labeled deaths. This may be due to more of these people moving into LTC facilities and so seeing less preventable acute emergency deaths.
10/18
10/18
85 and over is puzzling. There are significant excess deaths (10%) and they are almost all Covid-labeled. Yet this is where one would expect to see a strong effect from the 31,514 excess Alzheimer’s deaths and other age dominant illnesses.
11/18
11/18
This leads me to believe the 85+ group is likely seeing the strongest death misattribution effects. I wrote about such effects here. This group will have a higher number of people close to death from other causes and Covid pushes them over the edge.
https://thefederalist.com/2020/11/04/cdc-data-suggest-lockdowns-could-kill-as-many-people-as-covid/
12/18
https://thefederalist.com/2020/11/04/cdc-data-suggest-lockdowns-could-kill-as-many-people-as-covid/
12/18
For 85+, the alternative is to believe something like the 3,963 excess deaths in this group are all Alzheimer’s, but people under 85 saw 7 times more excess Alzheimer’s deaths than those over 85. This doesn't seem plausible.
13/18
13/18
For me, this data reinforces the pre-Covid thinking: Wide spread NPIs should not be employed since damage they do far outweighs benefits.
They make a bad situation worse by adding preventable deaths to those we cannot avoid.
Solution: Open up.
https://twitter.com/Dierenbach/status/1330279742172491778?s=20
14/18
They make a bad situation worse by adding preventable deaths to those we cannot avoid.
Solution: Open up.
https://twitter.com/Dierenbach/status/1330279742172491778?s=20
14/18
Switzerland seems to have followed Sweden's lead for their second wave and have weathered the storm.
Lockdowns are not the answer.
Open schools. Open businesses. Remove capacity limits.
Stop societal suicide.
15/18 https://twitter.com/aginnt/status/1333462294697631744?s=20
Lockdowns are not the answer.
Open schools. Open businesses. Remove capacity limits.
Stop societal suicide.
15/18 https://twitter.com/aginnt/status/1333462294697631744?s=20
Notes:
Some may counter this is evidence that we aren’t catching all Covid deaths. My response is this is the most tested disease in the history of mankind and there are strong financial incentives to find every case possible, so I do not think underreporting is an issue.
16/18
Some may counter this is evidence that we aren’t catching all Covid deaths. My response is this is the most tested disease in the history of mankind and there are strong financial incentives to find every case possible, so I do not think underreporting is an issue.
16/18
Data sources.
Weekly deaths 2015-present: https://data.cdc.gov/api/views/y5bj-9g5w/rows.csv?accessType=DOWNLOAD&bom=true&format=true%20target=
Weekly deaths 2015-present by cause group: https://data.cdc.gov/api/views/u6jv-9ijr/rows.csv?accessType=DOWNLOAD&bom=true&format=true%20target=
Since there is a delay in reporting death data to the CDC, I chose to work with data through week 40 (~early Oct.) for each year.
17/18
I used worldometers population data to boost previous years’ numbers to account for population growth.
Again, any feedback is welcome (even clever trolls). Please respond to the first tweet in this thread.
https://www.worldometers.info/world-population/us-population/
18/18
Again, any feedback is welcome (even clever trolls). Please respond to the first tweet in this thread.
https://www.worldometers.info/world-population/us-population/
18/18

 Read on Twitter


