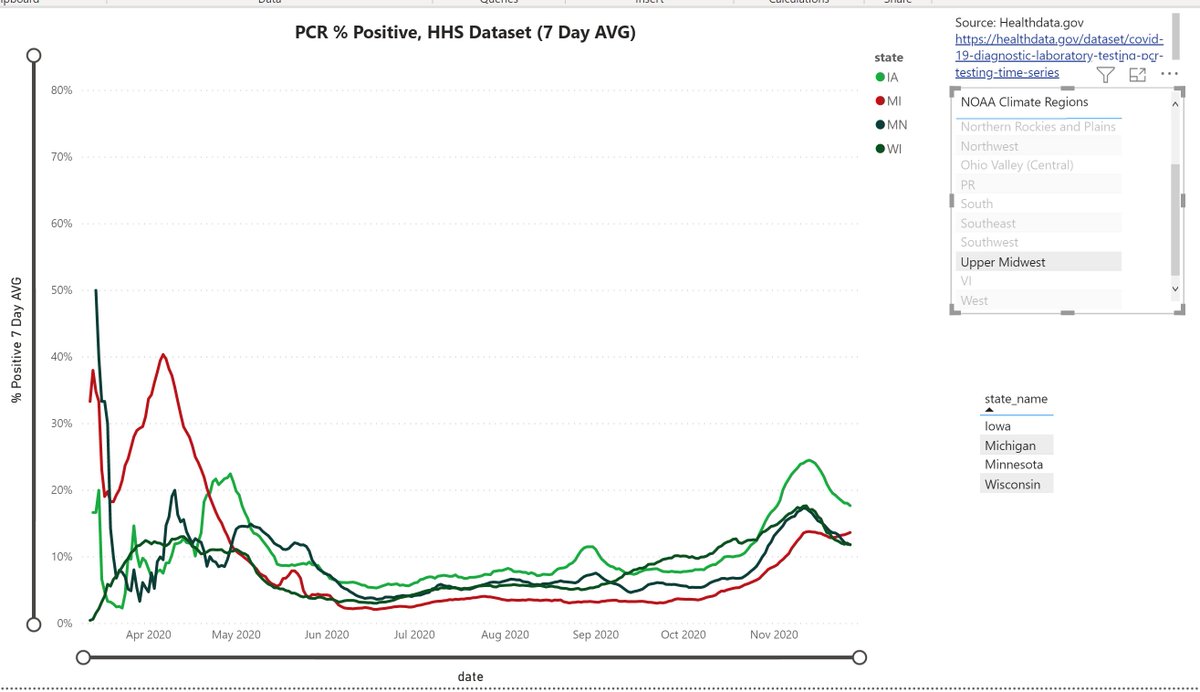
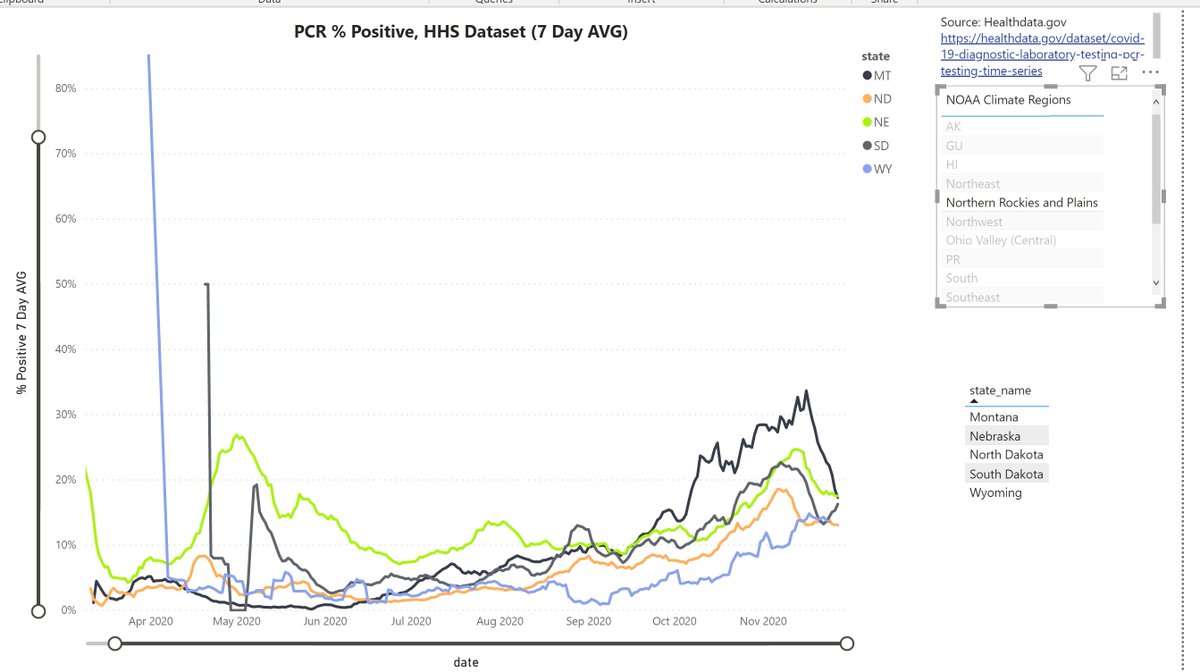
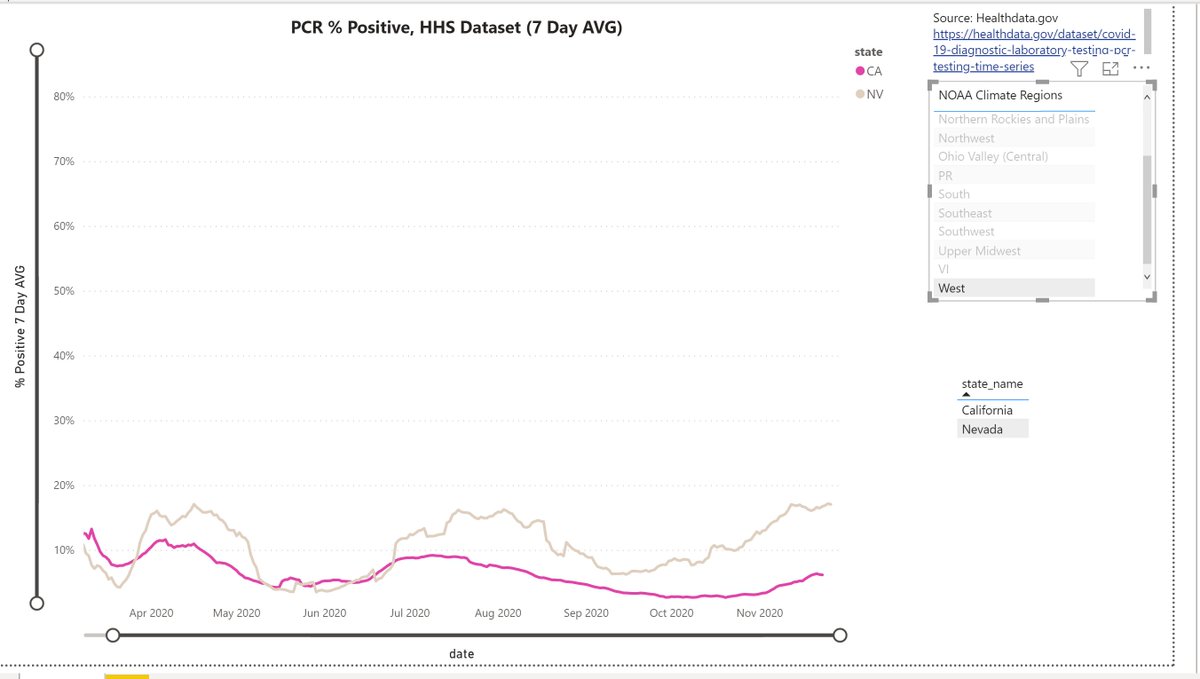
Are epidemic curves more influence by Non-Pharmaceutical Interventions, or Climate? Let's compare.
I have taken the % Positive curves for each state (from HHS data) and grouped each according to NOAA US Climate Regions.
Let's start with the Northeast :
I have taken the % Positive curves for each state (from HHS data) and grouped each according to NOAA US Climate Regions.
Let's start with the Northeast :
Would it surprise anyone to find out that some of these neighboring states have taken drastically different measures?
Next I'll group the curves according to similarities in NPI's inflicted (i mean enacted) within each state. We will see.
#RationalGround
Next I'll group the curves according to similarities in NPI's inflicted (i mean enacted) within each state. We will see.
#RationalGround

 Read on Twitter


