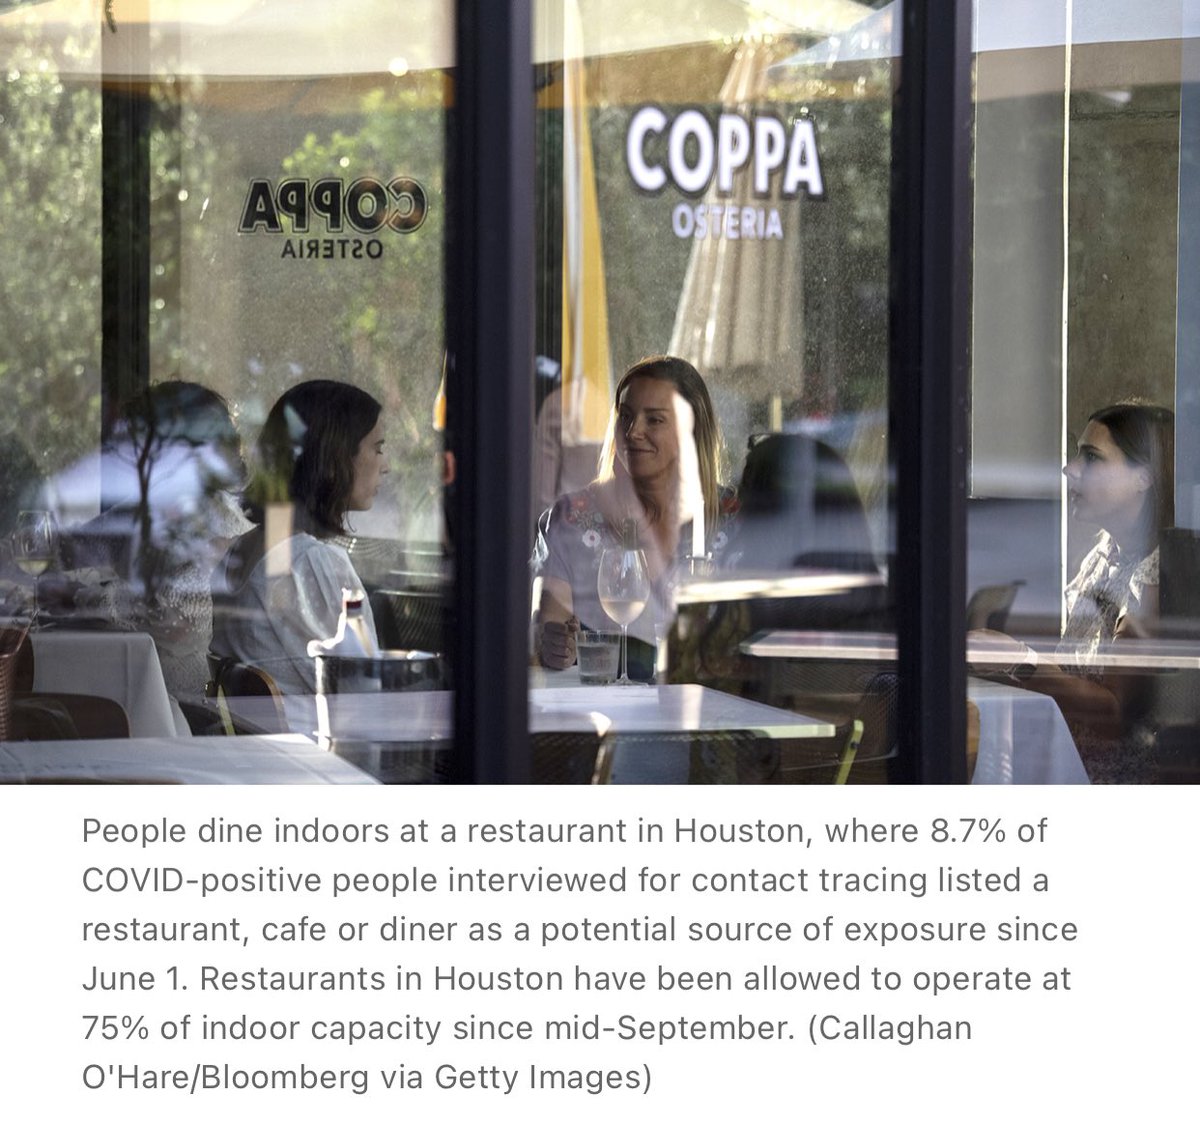
 Restaurants appear to be among the most riskiest and common places to get infected with the #COVID19, but we still don’t trace close to enough. How sure are we about bars and restaurants being major spreaders? Pretty darn sure.
https://californiahealthline.org/news/failed-contact-tracing-at-restaurants-leaves-diners-in-the-dark/
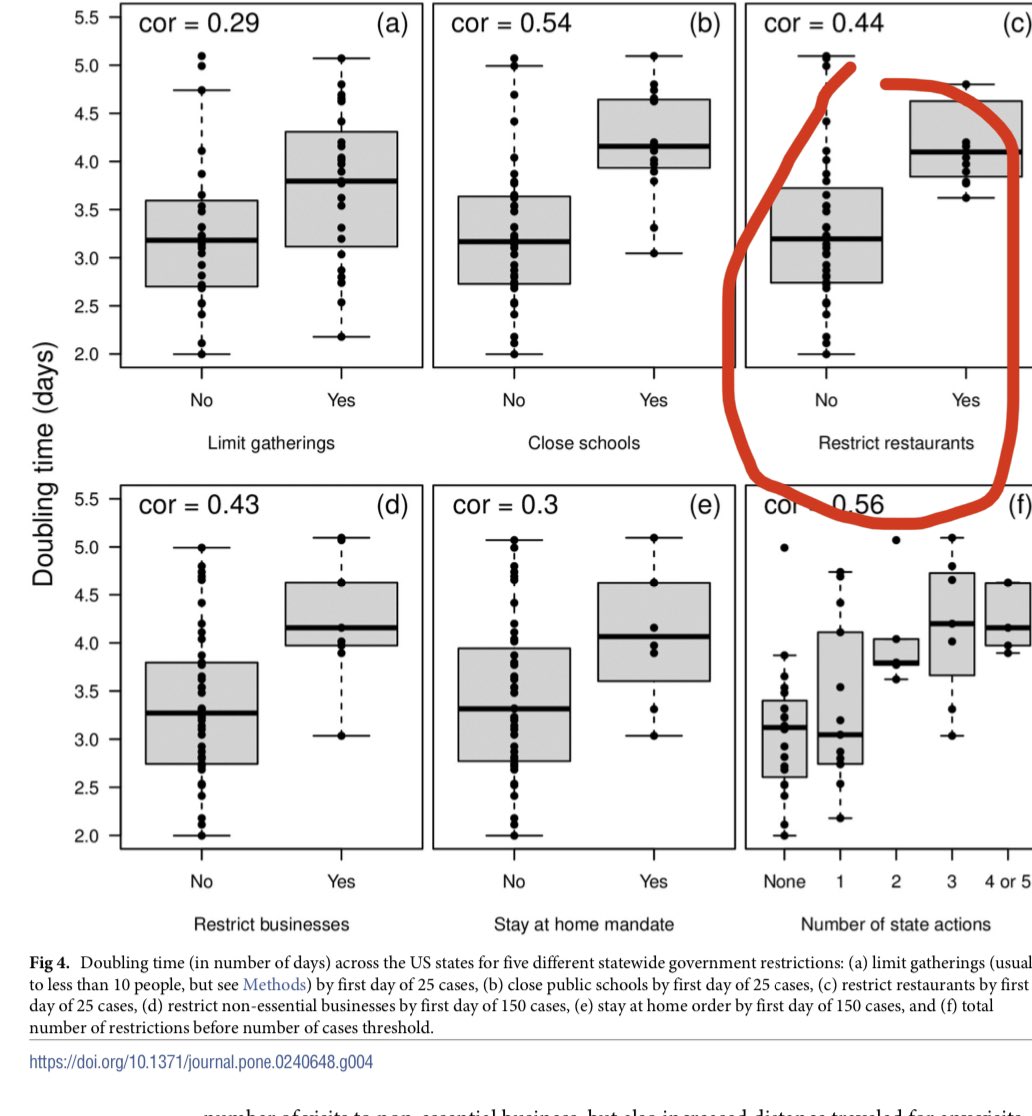
2) Out of the many social distancing restrictions states chose to implement at the beginning of the pandemic, shutting down restaurants had the strongest correlation to reducing the spread of the disease, according to researchers at U of Vermont. https://www.ncbi.nlm.nih.gov/pmc/articles/PMC7553297/
3) In Japan, investigators use contact tracing to identify clusters of disease where people live or congregate. Out of about 3,000 cases confirmed from January to April in that country, investigators could identify 61 clusters, 16% of which were in restaurants or bars.
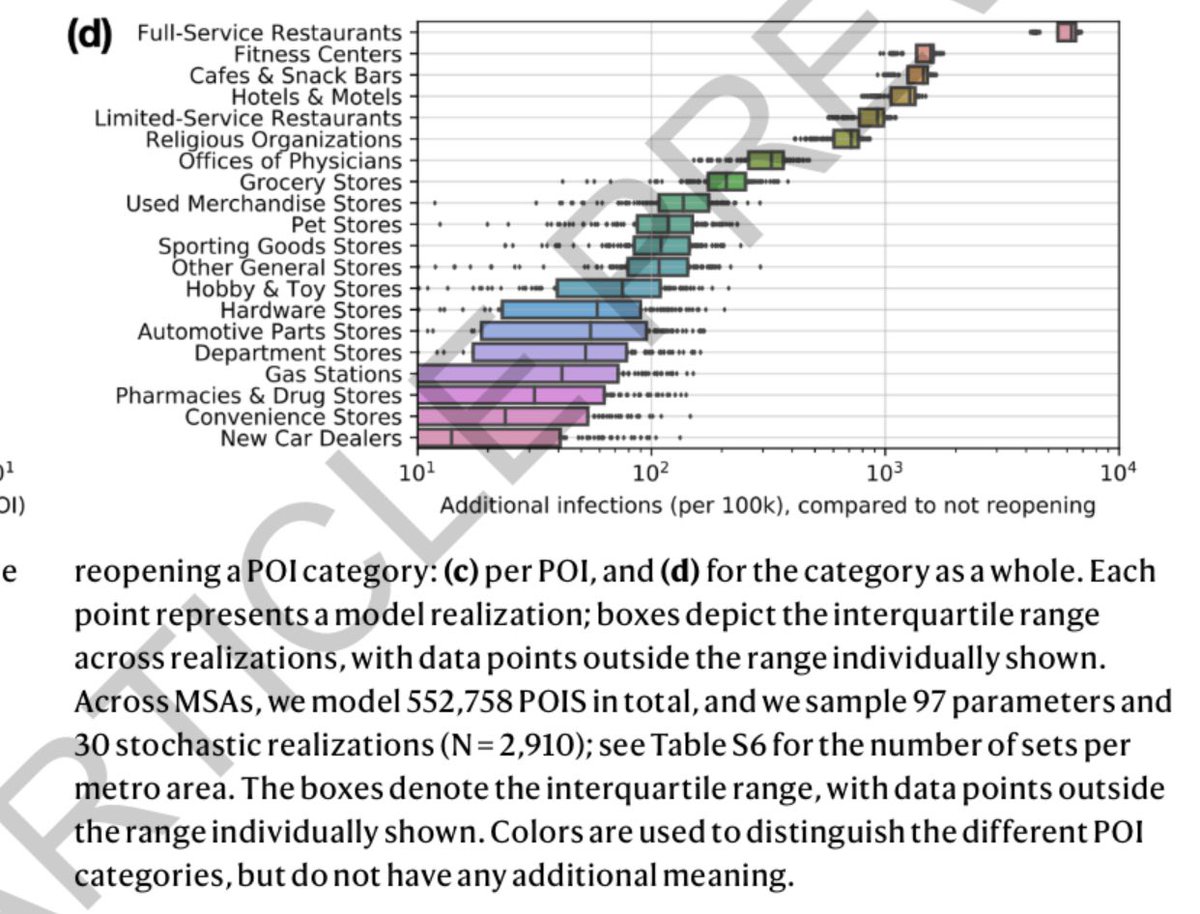
4) A recent Stanford University-led study that used mobile phone data from different cities to create a simulation of viral spread suggests that restaurants operating at full capacity spread four times as many additional COVID-19 infections as the next-worst location, indoor gyms
5) CDC study across 10 states found that those who had tested positive for COVID-19 were more than twice as likely to say they had dined at a restaurant in the two weeks before their illness began, compared with those who tested negative. https://www.ncbi.nlm.nih.gov/pmc/articles/PMC7499837/
6) In China, for instance, contact tracing revealed how a restaurant’s air conditioning unit may have carried a positive patient’s viral droplets from one table to two others, infecting nine other people. https://www.ncbi.nlm.nih.gov/pmc/articles/PMC7323555/
7) Great reporting by @annaalmendrala in this story. https://californiahealthline.org/news/failed-contact-tracing-at-restaurants-leaves-diners-in-the-dark/
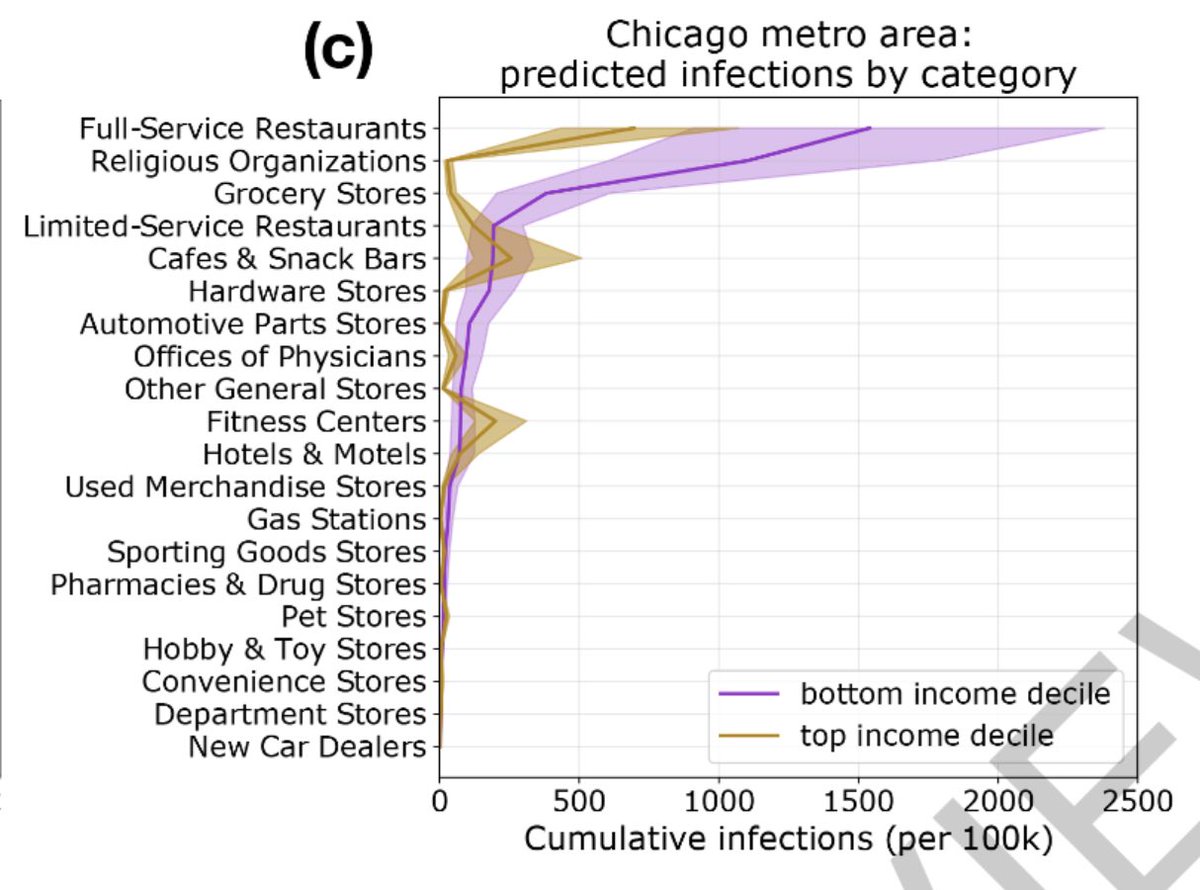
8) I really want people to dive into this Stanford study that used @SafeGraph data. It clearly shows just how much each contribute to additional infections from reopening: clearly restaurants top, but also gyms, cafes, hotels, limited service restaurants. https://www.nature.com/articles/s41586-020-2923-3.epdf?sharing_token=c2VoryoYtQWd97ZdgEeRENRgN0jAjWel9jnR3ZoTv0P4QCkIKJMffNLo7c2z6ZZTYnGvAvX3fI35Ev4XiT4qy_Aw6981p_PWN2cUGQp-Db0e94Jx4cKJQKn89MbI01LV-5MeKLdkAFZjD7pS4mC45svhw8DcXn1DInTY6nWUQ50%3D
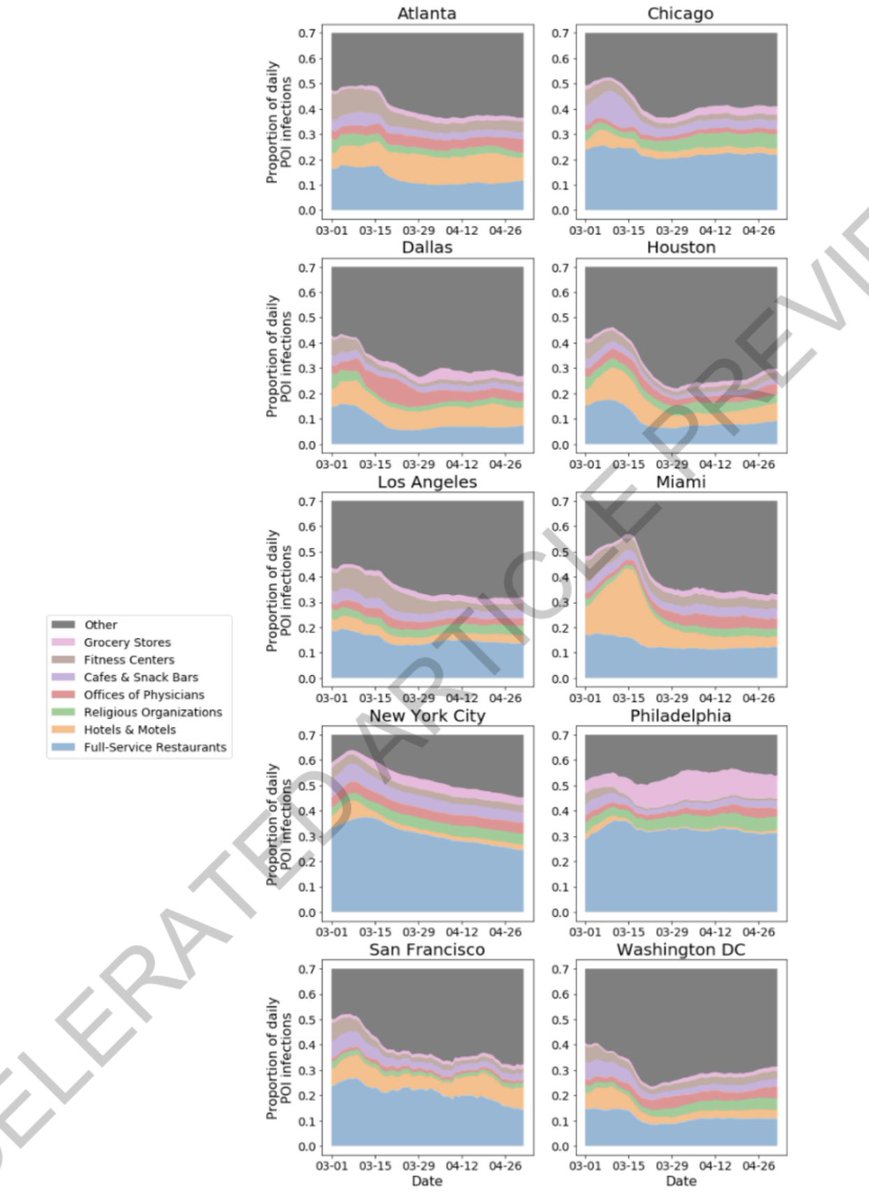
9) Moreover, full service restaurants (light blue) were modeled also as major infection source across many metro areas.
10) Also what about these businesses and infection across income groups? Full service restaurants again stand out. But notice how among high income groups, **cafes and gyms** stand out a lot more as infection groups. While in low income groups, **churches** and grocery stores.
11) What is the best way to measure risk of aerosol transmission indoors? Use this Very interactive calculator. https://twitter.com/DrEricDing/status/1332295969786966020

 Read on Twitter