Here's a thread on where British Columbia currently stands in its #COVID19 fight.
Follow along if you like charts, anxiety, and possibly reassuring context in equal measure!
Follow along if you like charts, anxiety, and possibly reassuring context in equal measure!
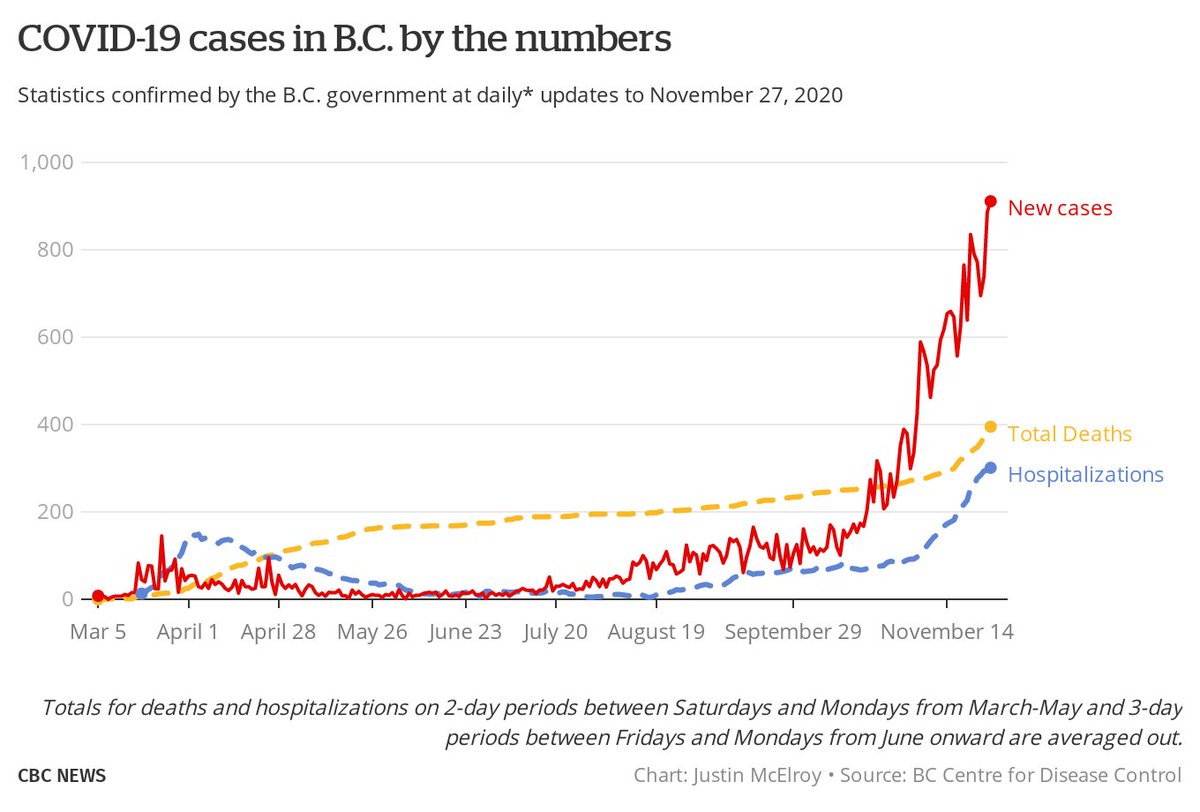
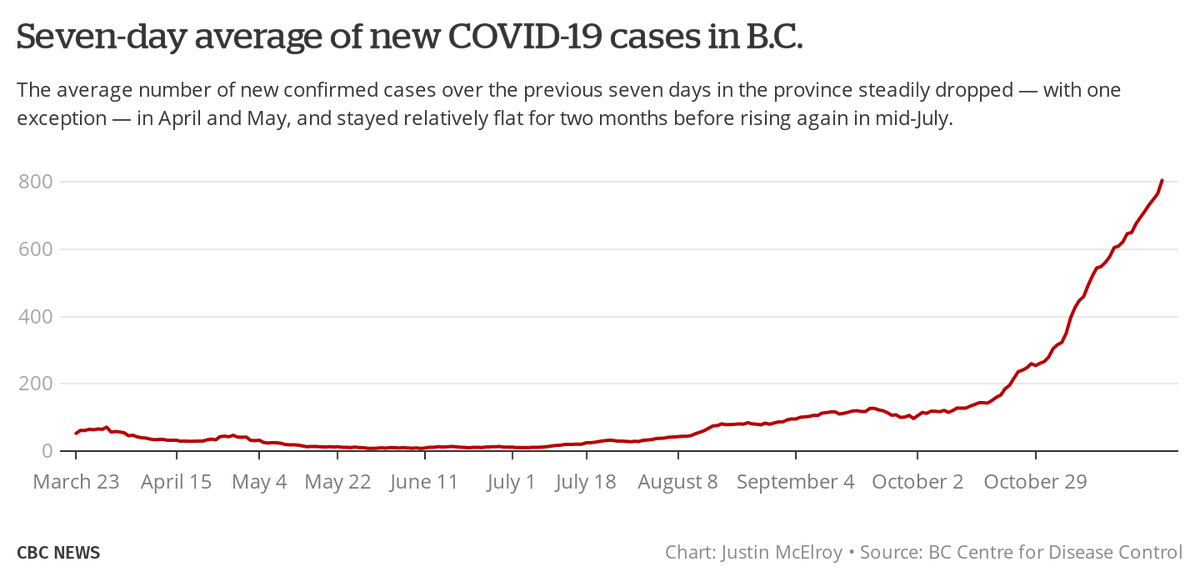
As we know, the topline numbers in British Columbia were the worst we've seen last week.
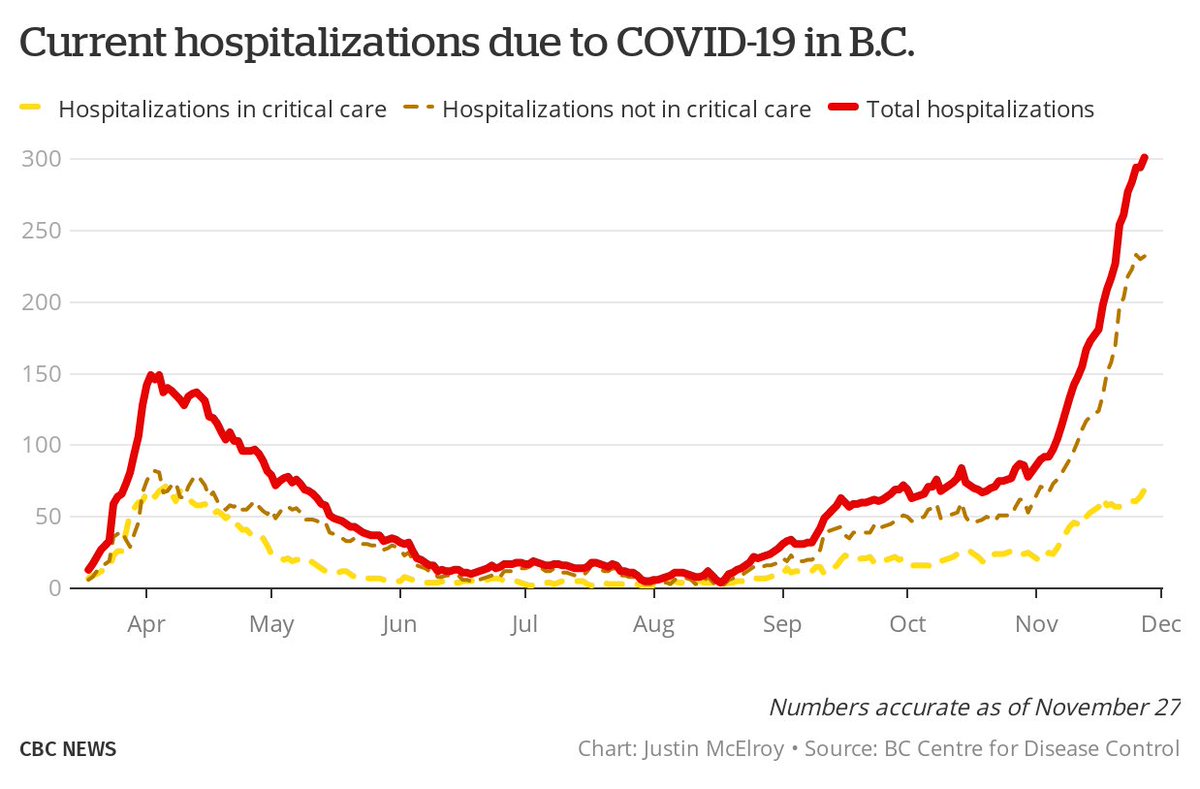
Daily cases, active cases, hospitalizations, and weekly deaths all at their highest levels.
We are still below the record for people in critical care, but that's it.
Daily cases, active cases, hospitalizations, and weekly deaths all at their highest levels.
We are still below the record for people in critical care, but that's it.
You might have heard this is evidence the Nov. 7 restrictions put in by the province for the Lower Mainland did not work, or were ineffective.
That's not actually true.
Essentially, the positive news in the 604 area code were masked by bad news beyond Hope.
That's not actually true.
Essentially, the positive news in the 604 area code were masked by bad news beyond Hope.
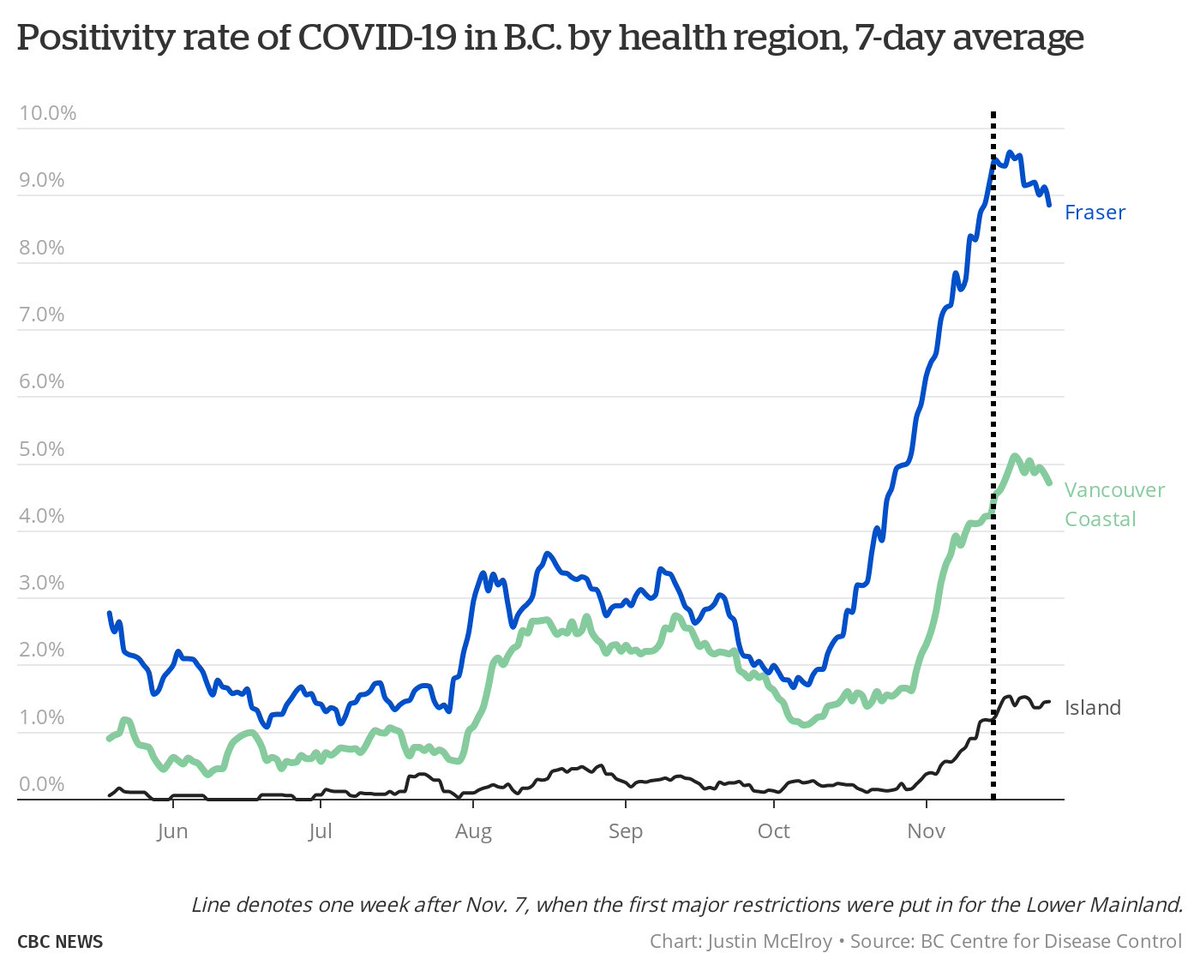
Let's take a look at a new chart, looking at the rolling 7-day positivity rate in Coastal Health, Fraser Health, and Island Health.
It shows that a week after the restrictions were announced, the increase in the rate stabilized after week and weeks of concerning growth.
It shows that a week after the restrictions were announced, the increase in the rate stabilized after week and weeks of concerning growth.
But now let's look at the rolling positivity rate in Interior and North Health.
They continue to go up, and are now at fairly concerning numbers.
It will be crucial to see if the numbers stabilize this week.
They continue to go up, and are now at fairly concerning numbers.
It will be crucial to see if the numbers stabilize this week.
Two things slightly concerning about stabilizing Interior/Northern Health numbers:
- Lack of data means there's lag time before a community knows for sure there's been a major outbreak (see: Revelstoke this week)
- These regions also seem to have had more anti-mask altercations
- Lack of data means there's lag time before a community knows for sure there's been a major outbreak (see: Revelstoke this week)
- These regions also seem to have had more anti-mask altercations
When it comes to the ages of people getting #COVID19, there has been a consistent worry about schools driving the growth of transmission.
But so far, the evidence is not showing this.
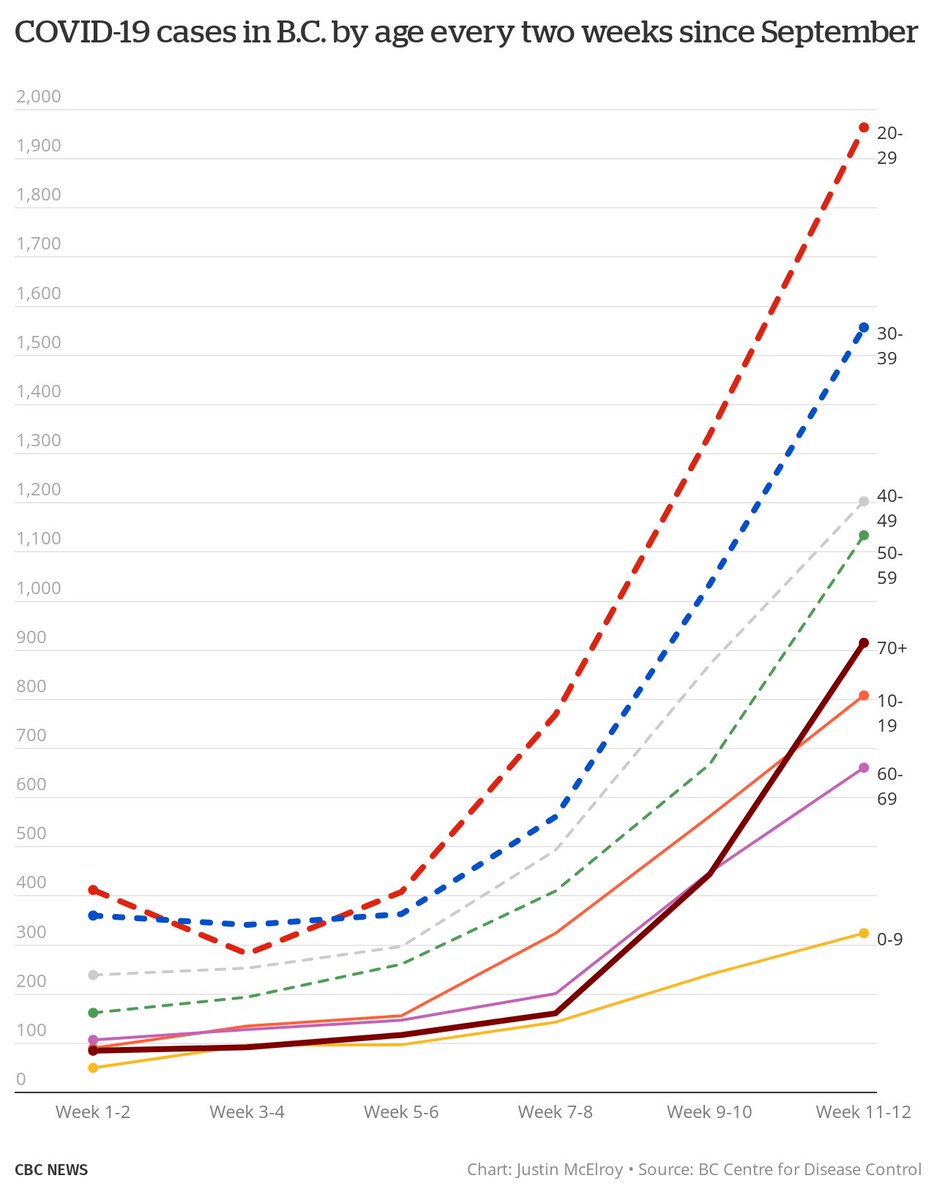
Here's a look at total numbers of new cases by age group, every two weeks since September.
But so far, the evidence is not showing this.
Here's a look at total numbers of new cases by age group, every two weeks since September.
The increase we've seen in general transmission in the past six weeks is affecting 10-19 year olds at a consistent rate, with much slower growth for kids under 10.
Where we are seeing a big change is people over 70, which is obviously concerning for a number of reasons.
Where we are seeing a big change is people over 70, which is obviously concerning for a number of reasons.
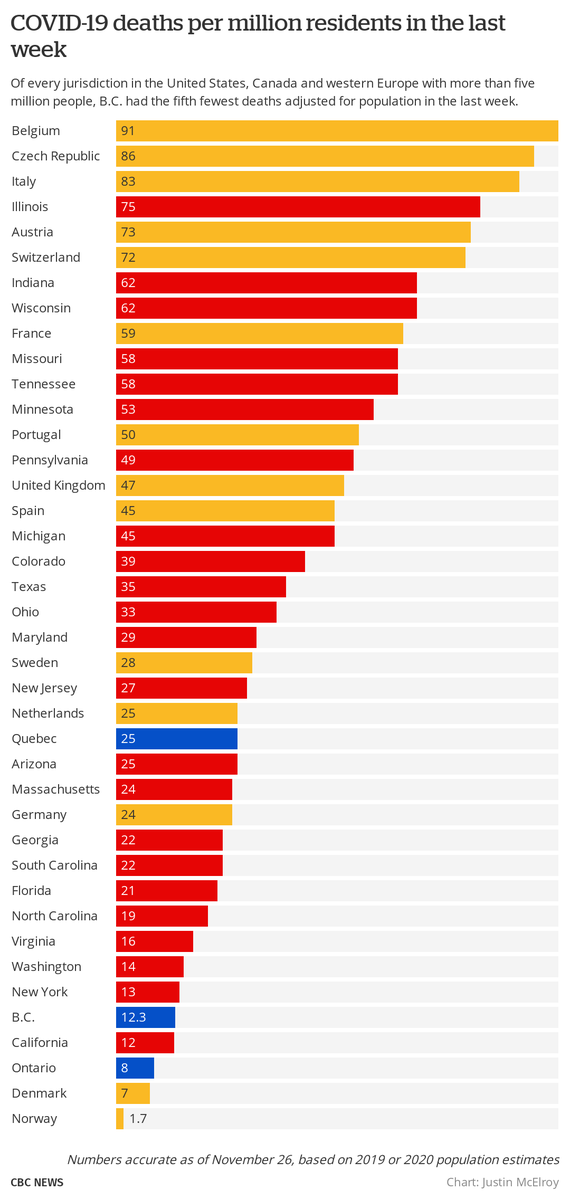
Because of spread of #COVID19 in people 70 and up in the last month, the province's death rate has increased significantly, and should continue to grow.
It means across the jurisdictions I've consistently used as comparables, B.C. is no longer leading in preventing fatalities.
It means across the jurisdictions I've consistently used as comparables, B.C. is no longer leading in preventing fatalities.
The state/province/western Europe/five million chart does underline how much all of North America and Europe are struggling right now.
It's a big reason why the debate over #COVIDzero is not going away, because there are few successful counterexamples at the moment.
It's a big reason why the debate over #COVIDzero is not going away, because there are few successful counterexamples at the moment.
These are mixed rates — results showing public and private testing begin this week.
However, the weekly rolling average of the positivity rate already correlates to data we see in active cases, hospitalizations, etc.
Data silver bullets are rare. https://twitter.com/geo_megs/status/1333131816761315328
However, the weekly rolling average of the positivity rate already correlates to data we see in active cases, hospitalizations, etc.
Data silver bullets are rare. https://twitter.com/geo_megs/status/1333131816761315328
"Most" is probably incorrect, but certainly overrrepresented.
Because of the data lag, hard to say more.
It is important for people to assume there is transmission in their community, and that it can take place easily through general gatherings. https://twitter.com/smithjosephy/status/1333131499873333249
Because of the data lag, hard to say more.
It is important for people to assume there is transmission in their community, and that it can take place easily through general gatherings. https://twitter.com/smithjosephy/status/1333131499873333249
Here are things to look for this week:
- Will the positivity rate in the Lower Mainland start to seriously fall, instead of just plateauing?
- If they don't, will further restrictions come?
- Will further increases in the rest of B.C. mask improvements in the Lower Mainland?
- Will the positivity rate in the Lower Mainland start to seriously fall, instead of just plateauing?
- If they don't, will further restrictions come?
- Will further increases in the rest of B.C. mask improvements in the Lower Mainland?
Hopefully this information helps!
B.C. continues to struggle to replicate the success of its first wave, and there is more frustration and anxiety than ever before.
Control what you can, and encourage those you care about to do the same.
B.C. continues to struggle to replicate the success of its first wave, and there is more frustration and anxiety than ever before.
Control what you can, and encourage those you care about to do the same.

 Read on Twitter