A new mask study was published yesterday.
CNN & others ran with it claiming "mask mandates work"
While most will simply accept the headline…
it's as an opportunity to educate… sometimes studies & headlines aren't always as they seem.
Short thread… https://www.cnn.com/2020/11/20/health/mask-mandates-kansas-coronavirus-wellness/index.html?utm_source=twCNN&utm_medium=social&utm_term=link&utm_content=2020-11-28T15%3A01%3A05
2/ The study (link below) looked at case trends in mask & non-mask mandate counties in Kansas.
This study had positive aspects... it looked at real-life conditions & compared areas that were geographically close during a consistent seasonal period. https://www.cdc.gov/mmwr/volumes/69/wr/mm6947e2.htm?s_cid=mm6947e2_w
This study had positive aspects... it looked at real-life conditions & compared areas that were geographically close during a consistent seasonal period. https://www.cdc.gov/mmwr/volumes/69/wr/mm6947e2.htm?s_cid=mm6947e2_w
3/ Here's where it gets interesting…
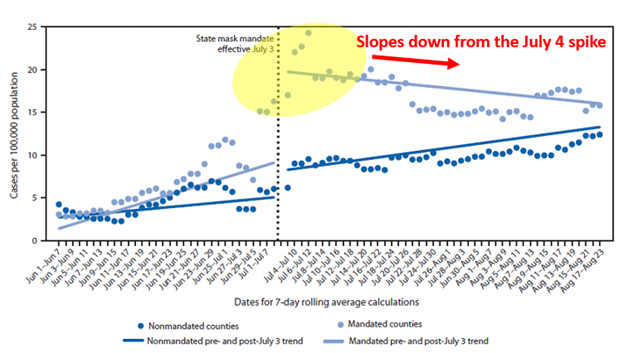
The Kansas mask mandate began July 3, around the July 4 holiday.
The mask mandate counties saw a spike in cases around this holiday.
The study then used this spike as its starting point & showed a decline in cases thereafter.
See below.
The Kansas mask mandate began July 3, around the July 4 holiday.
The mask mandate counties saw a spike in cases around this holiday.
The study then used this spike as its starting point & showed a decline in cases thereafter.
See below.
4/ It doesn’t take much to see that the July 4th spike changed the slope of the line for the mask mandate counties.
But there's more…
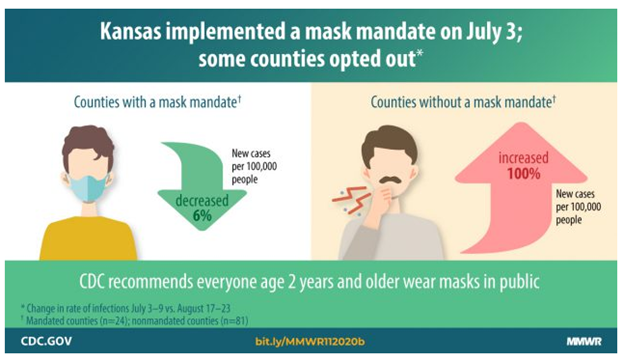
The study makes this decline from the July 4 holiday spike the centerpiece of its findings… saying the decline proves masks work.
See below.
But there's more…
The study makes this decline from the July 4 holiday spike the centerpiece of its findings… saying the decline proves masks work.
See below.
5/ The study should have eliminated this July 4th holiday noise… but it didn’t.
So, eternally curious, I decided to do it myself to see what it showed.
I pulled the CDC case data for all these counties during the exact same time period.
Source: https://usafacts.org/visualizations/coronavirus-covid-19-spread-map/state/missouri
So, eternally curious, I decided to do it myself to see what it showed.
I pulled the CDC case data for all these counties during the exact same time period.
Source: https://usafacts.org/visualizations/coronavirus-covid-19-spread-map/state/missouri
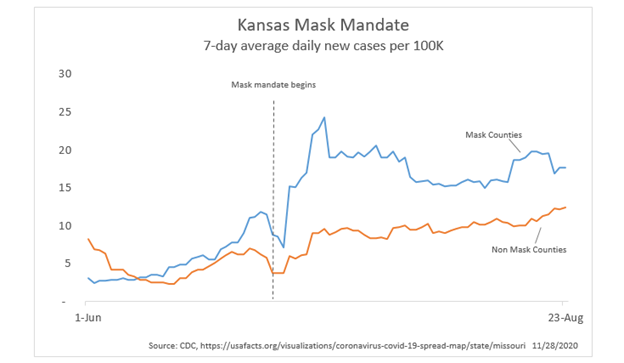
6/ Then I did a clean comparison: June vs Aug, new cases/capita just like the study…
What did I find?
No significant difference between the mask counties & the no mask counties.
Mask mandate counties +210%
Non mask mandate counties +195%
See below.
What did I find?
No significant difference between the mask counties & the no mask counties.
Mask mandate counties +210%
Non mask mandate counties +195%
See below.
7/ It doesn’t end there.
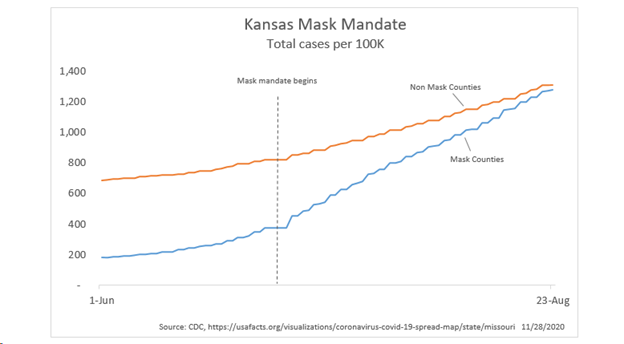
The study focused on rates of change, not absolute cases.
Actual daily cases per capita in the mask counties were consistently higher during this period.
Thus, total cases per capita in the mask mandate counties actually grew faster.
See below.
The study focused on rates of change, not absolute cases.
Actual daily cases per capita in the mask counties were consistently higher during this period.
Thus, total cases per capita in the mask mandate counties actually grew faster.
See below.
8/ That means the county with a mask mandate actually had more cases each day than the county without the mask mandate with the exact same population.
Needless to say, that doesn’t say much for mask mandates.
But, don't hold your breath for any headline corrections…
Needless to say, that doesn’t say much for mask mandates.
But, don't hold your breath for any headline corrections…

 Read on Twitter


