Data Crunching coming up. So far 47 trading weeks of 2020 has gone. Looking from weekly expiry perspective i.e. We Open on Friday and Close on weekly expiry, I wanted to see how #Nifty has performed. And results are astounding and eye opener. A Thread...+
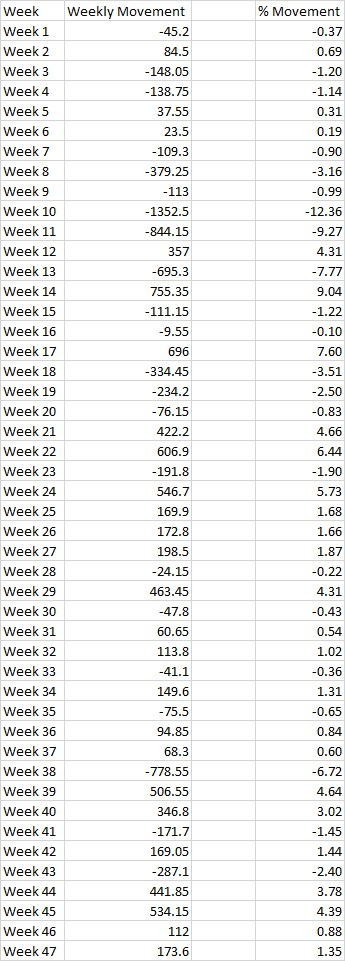
We saw biggest bull week of 3 April to 9 April 2020 when #Nifty ran the most i.e. 755 points. When writing calls, for me this for now is how high market can go. At least it sets a benchmark. So if Nifty is at 13000 and you are selling strangle at 13300/12700...+
How wrong you can be? Well market can still move 400 point against you by benchmark figures.
Biggest bear week was of 6 March to 12 March 2020 when #Nifty fell the most i.e. -1352, but I believe no body was writing puts at the moment due to #COVID19 peak...+
Biggest bear week was of 6 March to 12 March 2020 when #Nifty fell the most i.e. -1352, but I believe no body was writing puts at the moment due to #COVID19 peak...+
Preceding week was again a week with massive fall of -855 points. Thats two days of combined 2200 points. This was peak. In normal environment when we were recovering, 18 September to 24 September was the week when...+
#Nifty fell -778 points straight. Thats another bench mark set for weeklies on how low we can go. Kabhi to uthega kind of thing. If I have to take these two figures as benchmark, then today If I have to write a strangle on Friday, I might be safe till...+
+- 750 points in worst case scenario. Call of 13700 is at 2.50 and put of 12300 is at 2.50. Even if we consider 12500 and 13500 strikes than its a total risk:reward of 12:188. Not counting probabilities. Just an estimate on how wrong you can go selling options...+
As far as Bullish weeks are concerned, we had total 9 weeks where movement was more than 400+ points straight way. Weeks with Bearish movement of more than 400 points were 4, but were extreme. More than 300 point fall were 6 weeks....+
For sideways movement where movement was between -150 to 150 points, we had 21 such weeks. Out of 47 weeks, only 21 weeks where movement was sideways. 28 if we widen it to 200. Thats 300 - 400 point of sideways movement in a weeks time...+
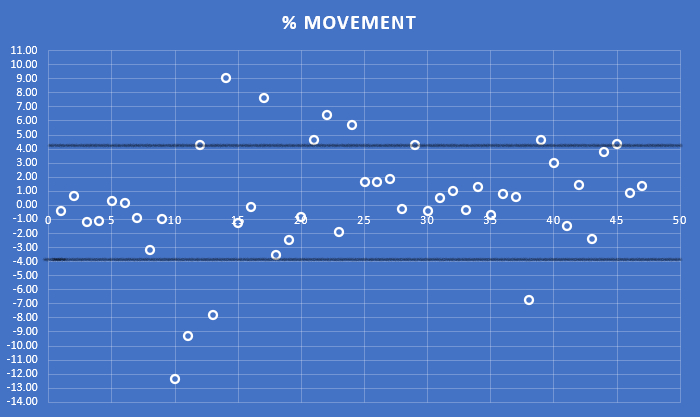
I wanted to check what is the new normal. Are we in an exceptional trading year. Here is what I found:
Majority of weeks are concentrated between -4 to 4 %, which is huge actually. Thats a swing of 200 points to 800 points every now and then....+
Majority of weeks are concentrated between -4 to 4 %, which is huge actually. Thats a swing of 200 points to 800 points every now and then....+
How much it can swing, we cannot say, but just looking at data, one thing is clear for me. Swings are big. And doing weekly options for positional can be stressful as you will be caught in the wrong too often. These are just my initial findings.

 Read on Twitter


