A summary of the data I presented at this afternoon's @IndependentSage briefing taking in the latest on Cases, Hospitalisations and Death statistics.
On cases and hospital admissions, it's largely been a good news week.
A thread. 1/13
On cases and hospital admissions, it's largely been a good news week.
A thread. 1/13
Cases first.
Across the whole of the UK reported cases have been falling for a couple of weeks now, and fairly steeply, although from a high peak.
We're down to a 7-day average of around 15,000 cases per day.
Across the whole of the UK reported cases have been falling for a couple of weeks now, and fairly steeply, although from a high peak.
We're down to a 7-day average of around 15,000 cases per day.
Across the country cases (per 100K) in most Local Authorities have fallen compared to where we were on lockdown day (3 weeks ago 5/11/20).
A few areas have gone backwards, but for most cases are coming down.
Maps by @TravellingTabby
A few areas have gone backwards, but for most cases are coming down.
Maps by @TravellingTabby
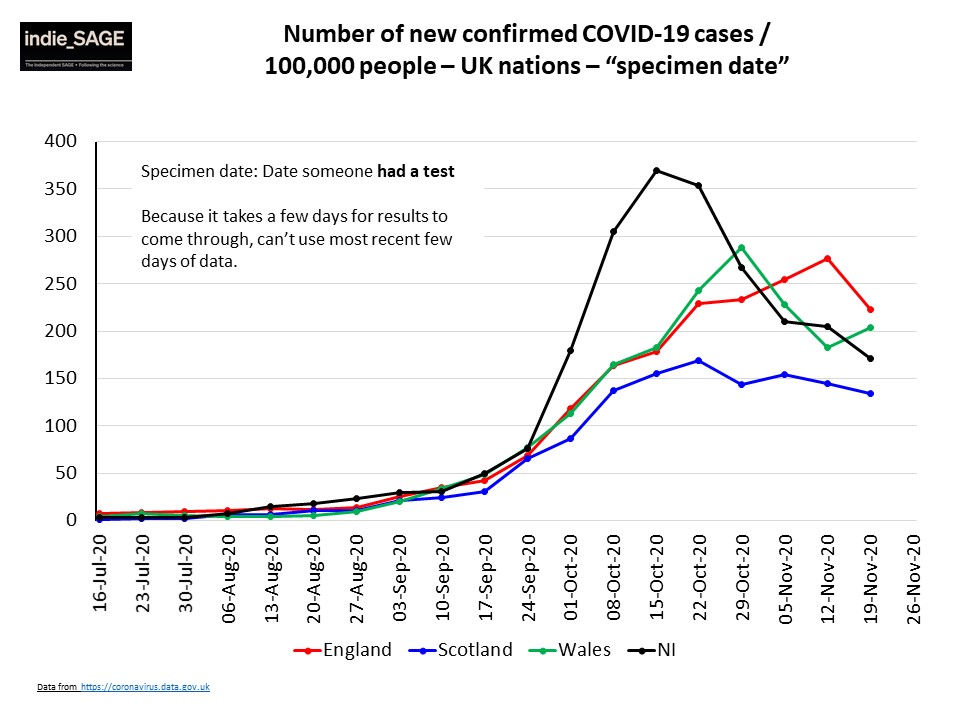
The number of new confirmed cases (per 100K) across all nations are coming down, as a result of the various restrictions that have been imposed. (Circuit Breaker in NI, Lockdown in England, 5-tier system in Scotland, firebreak in Wales).
Wales looks like it's increasing, but...
Wales looks like it's increasing, but...
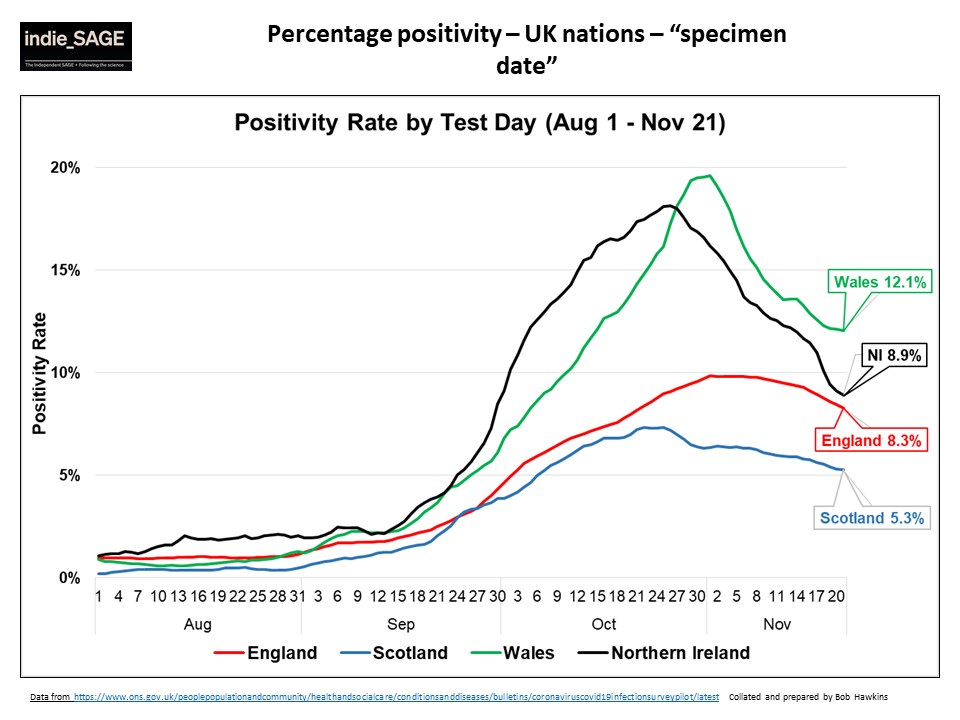
...when you look at percentage positivity, all four nations are decreasing (including Wales), which suggests Wales' rise in cases is due to more testing.
Over all a good picture for all four nations.
Over all a good picture for all four nations.
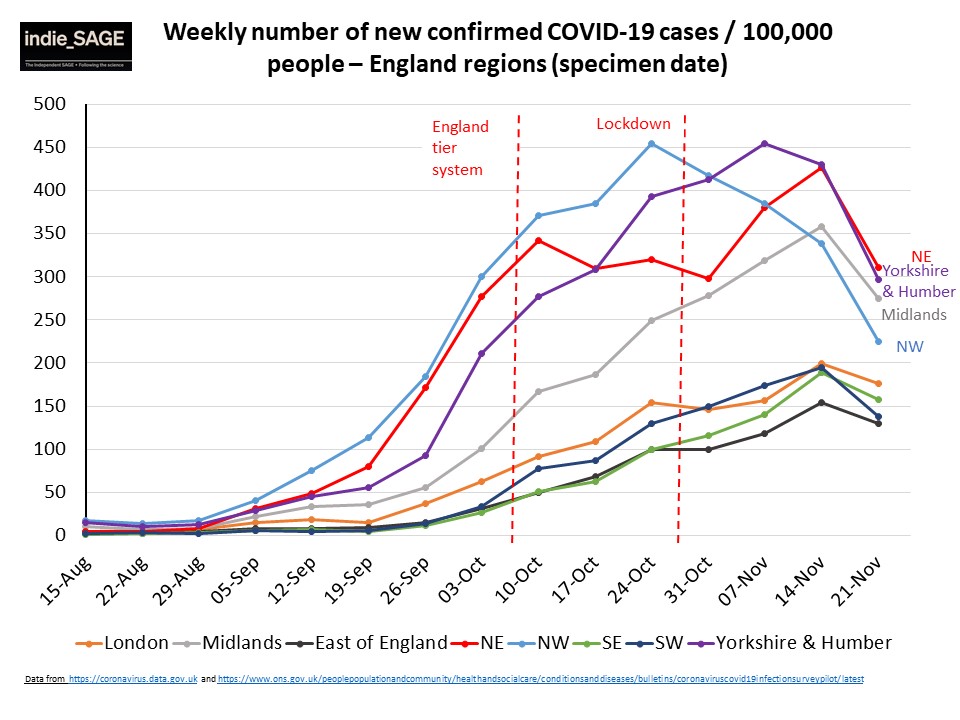
Delving deeper into cases, we can see drops across all of England's regions. Big drops in some cases, which is encouraging.
To be honest though, if we weren't seeing this sort of movement by now we'd be a bit worried that the lockdown wasn't working.
To be honest though, if we weren't seeing this sort of movement by now we'd be a bit worried that the lockdown wasn't working.
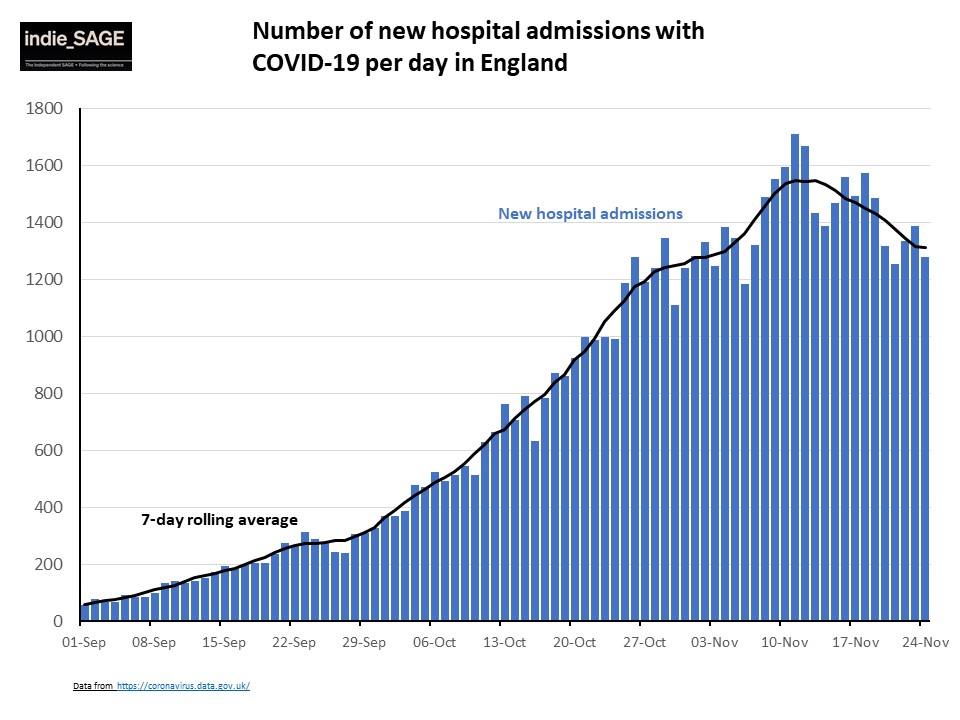
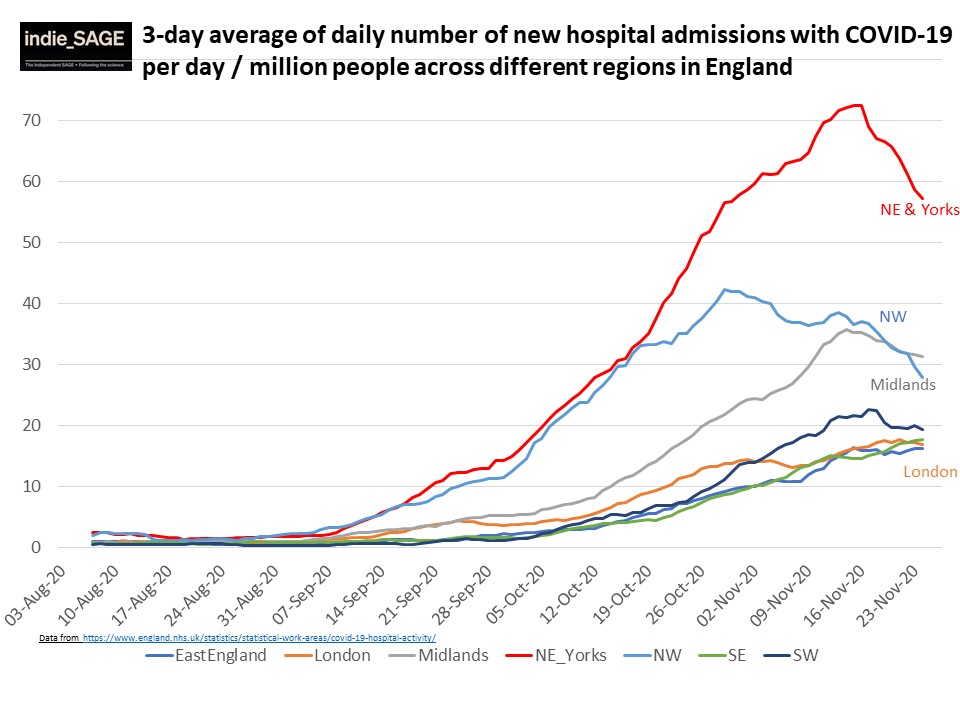
Moving on to hospitalisations (England). We're starting to see consistent falls in the number of new admissions, which again is good news, although hospital occupancy with COVID patients is still high.
Looking by English region again we can see the biggest drops in new hospital admissions in the regions we were most worried about (with the highest levels of admissions - i.e NW, NE, Midlands).
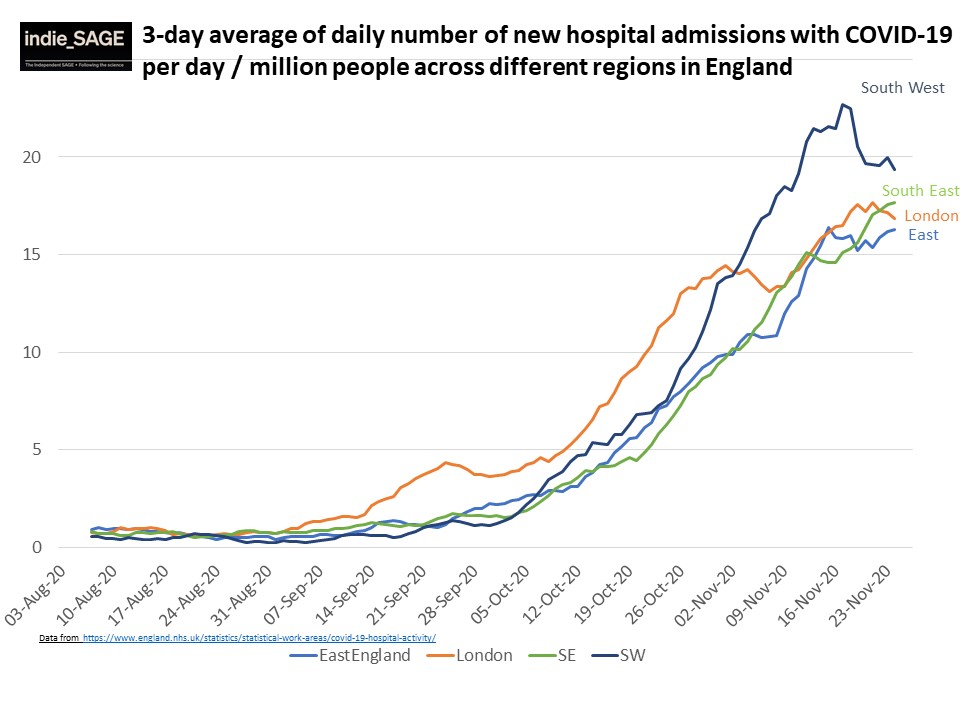
Zooming in on some of the regions with lower levels we can see that London and the South West are falling, but the South East and the East look to be rising slowly or levelling off.
But overall a good picture for the trends in new hospital admissions across the country.
But overall a good picture for the trends in new hospital admissions across the country.
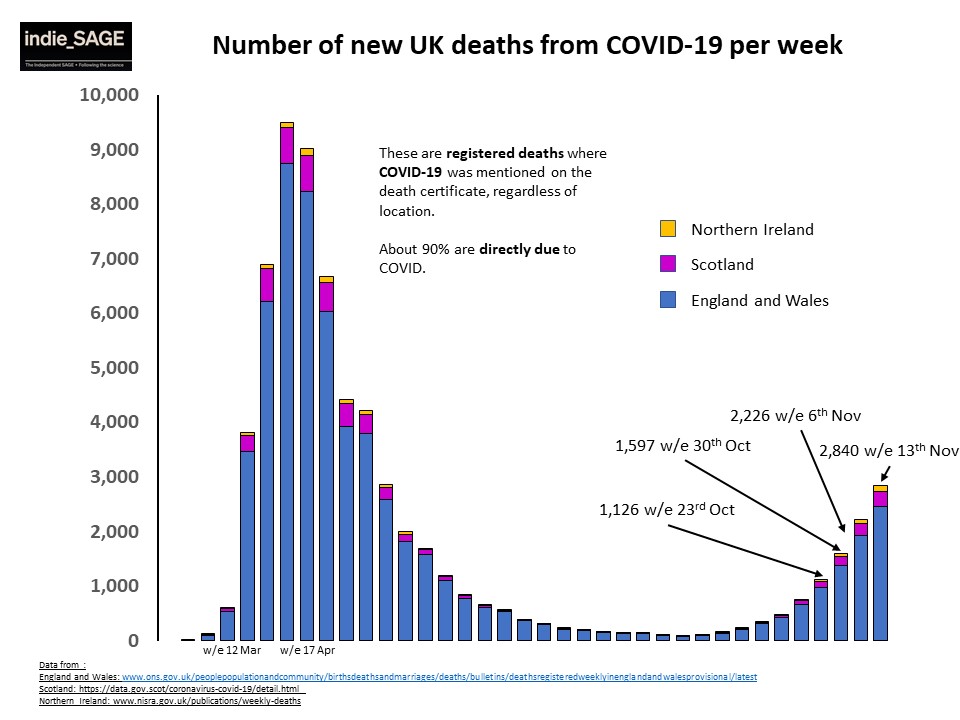
Deaths are continuing to increase (as we knew they would), but there are signs their increase is slowing.
Weekly data from the ONS is the gold standard (based on Death certificate), but is lagged.
Shows that deaths across all four nations are no longer doubling every two weeks.
Weekly data from the ONS is the gold standard (based on Death certificate), but is lagged.
Shows that deaths across all four nations are no longer doubling every two weeks.
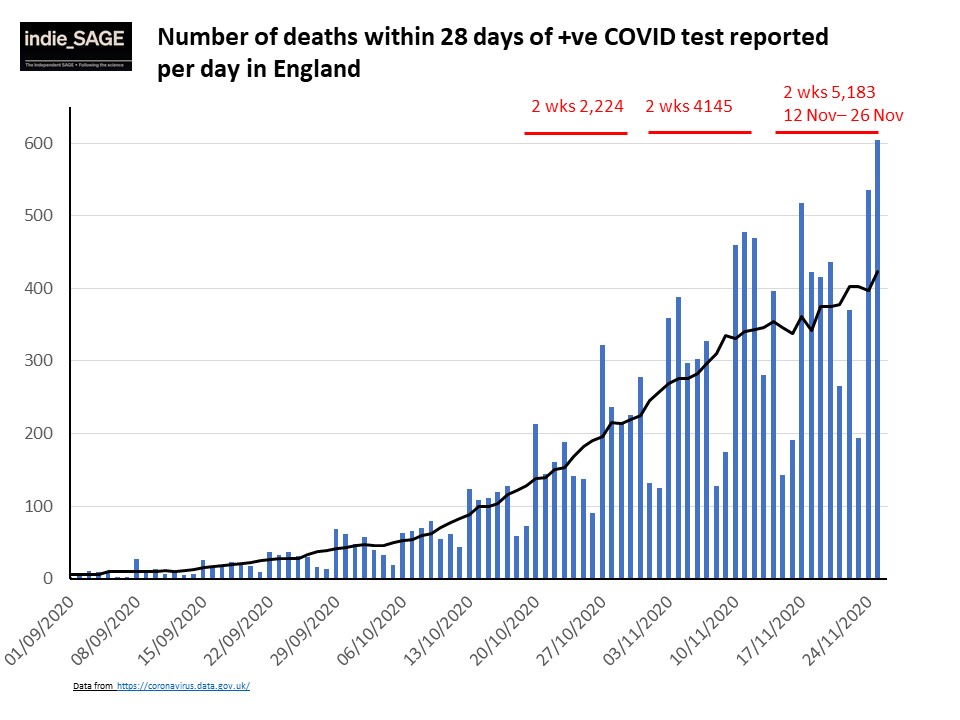
For a more up-to-date picture, these are figures from PHE. They also show deaths continuing to rise (more obvious once the fluctuations are averaged over using the 7-day average), but at a slower rate. No longer doubling every two weeks.
Just because these large numbers of deaths are happening now at a time when cases are coming down, this shouldn't in anyway diminish their importance.
We are seeing the highest rates of COVID deaths now since early May.
The worst thing is that we knew it was coming too.
We are seeing the highest rates of COVID deaths now since early May.
The worst thing is that we knew it was coming too.
So while it's good news that lockdown has brought cases and hospitalisations down.
Earlier action would have prevented many of these unnecessary deaths.
It's a lesson we surely have to learn if we are to keep COVID at bay.
/ENDS
Earlier action would have prevented many of these unnecessary deaths.
It's a lesson we surely have to learn if we are to keep COVID at bay.
/ENDS

 Read on Twitter


